UK Renewables Obligation (RO)¶
The Renewables Obligation is the scheme you've never heard of, twice the size of the one you have. Across the covered scheme years 2006-2017 and 2019-2023, British electricity consumers paid approximately £58.6 bn in reconstructed RO subsidies. Including the deferred-data-gated years (2002-2005 and 2018, see §7 Data access), independent estimates put the full 2002-2024 total in the £65-70 bn range — making the RO the largest single renewable energy subsidy scheme in UK history by cumulative consumer cost, and materially larger than the more widely discussed Contracts for Difference scheme over the same period.
Unlike CfD, where payments flow from a central counterparty, RO costs are embedded directly in retail electricity bills via supplier obligations. The scheme closed to new accreditations in 2017 but continues to pay out until 2037 under 20-year support windows locked in during the 2002–2017 build-out phase.
The £58.6 bn figure is a reconstruction from publicly-downloadable Ofgem aggregate data covering covered scheme years (SY5-SY16 and SY18-SY22); years SY1-SY4 and SY17 are deferred-data-gated and excluded from this total. See §7 Methodology for scope, and §7 Data access for what is and is not currently reconstructable.
What is the RO?¶
The Renewables Obligation ran 2002-04-01 through 2017-03-31 (closed to new accreditations) and commits UK consumers to pay approximately £6 bn per year for another decade — to 2037-03-31. At its peak it was twice the size of the Contracts for Difference (CfD) scheme; cumulatively it remains the largest legacy renewables subsidy in the UK.
The mechanism: energy suppliers are legally obliged to present a quota of Renewables Obligation Certificates (ROCs) each "scheme year" (April-March). Certified renewable generators receive ROCs per MWh of eligible generation. The number of ROCs awarded per MWh — the "banding factor" — varies by technology and commissioning vintage:
- Onshore wind — 0.9 ROCs/MWh in the 2013-2017 banding window.
- Offshore wind — 2.0 ROCs/MWh during most of the build-out phase.
- Co-fired biomass — 0.5 ROCs/MWh at peak (pre-2013, dropping with vintage).
- Dedicated biomass conversion — 1.0 ROCs/MWh (Drax post-2013, Lynemouth).
- Solar PV — 1.4-2.0 ROCs/MWh depending on commissioning vintage and rooftop/ground-mount.
- Anaerobic digestion / hydro / wave-tidal / landfill gas — varied bandings, generally 1.0-2.0.
Suppliers either acquire ROCs from generators (the "buyout-recycle" market) or pay the annual buy-out price per shortfall ROC into a central fund administered by Ofgem, which is then recycled back to ROC-holding generators on a pro-rata basis. Effectively, consumers pay a commodity-priced premium (buyout + recycle, averaging ~£60-100 per ROC over the scheme's life) embedded in their electricity bills.
The scheme closed to new accreditations in March 2017 (replaced by CfD) but accredited stations continue receiving ROCs for 20 years from their accreditation date. The last station accreditations end in 2037, which is why the RO bill is predominantly a forward commitment, not a current policy choice.
Why the RO is "the scheme you've never heard of"¶
CfD has a public profile. It is named in DESNZ press releases, debated in select committees, and reported on every Allocation Round. The Renewables Obligation does not. The headline figure for the RO is many multiples of the CfD's cumulative cost-to-date, but the RO has been operating since 2002 — its big build-out years (2010-2017) coincided with the political focus on CfD launches, and journalists framing renewables-cost stories overwhelmingly cite the CfD as the active policy lever. The RO sits in the background of the consumer bill: it shows up as a line in the Standard Variable Tariff cost build-up, but rarely as a story in its own right.
Why it ends in 2037 (and why that matters)¶
The 20-year support window is a feature of the original Renewables Obligation Order. It is locked into accreditation contracts and cannot be unilaterally shortened by government without primary legislation and likely retrospective compensation. This means that the forward commitment is structurally protected: a future government cannot simply "cancel" the remaining ten years of RO bills any more than it can cancel ten years of CfD strike-price obligations. Both are commitments to specific named stations under contract.
The 2037 cliff is the date the last accredited station's 20-year window expires. After 2037 the RO bill goes to zero by operation of contract, not by political decision.
Cost dynamics (Chart S2)¶
Four panels (all GB-only per D-12 headline scope):
- Annual ROC-eligible generation (TWh). Shows the ramp from ~2 TWh in 2002 to ~50 TWh at the scheme's peak (2017-2020), flattening as new accreditations ceased.
- ROC price (£/ROC) — buyout + recycle. The consumer's cost per ROC ranged from ~£30 in the early years to >£100 during mutualisation-affected periods.
- Premium per MWh (£/MWh) — consumer overpayment. RO cost minus the gas counterfactual (see methodology page), divided by eligible generation. Peaks at ~£80/MWh when gas was cheap (pre-2021) and inverts briefly during the 2022 gas-price crisis when gas plant costs temporarily exceeded the RO premium per MWh.
- Cumulative RO bill (£bn). The running total. A visible step up in 2021-22 from the mutualisation event: £44.0M redistributed to ROC-holders after £119.7M of supplier defaults. The cumulative trace is the headline number; everything else on this page is a decomposition of how it got there.
The vertical band at 2017 marks closure to new accreditations; costs continue to rise as existing accredited stations remain on 20-year support windows.
By technology (Chart S3)¶
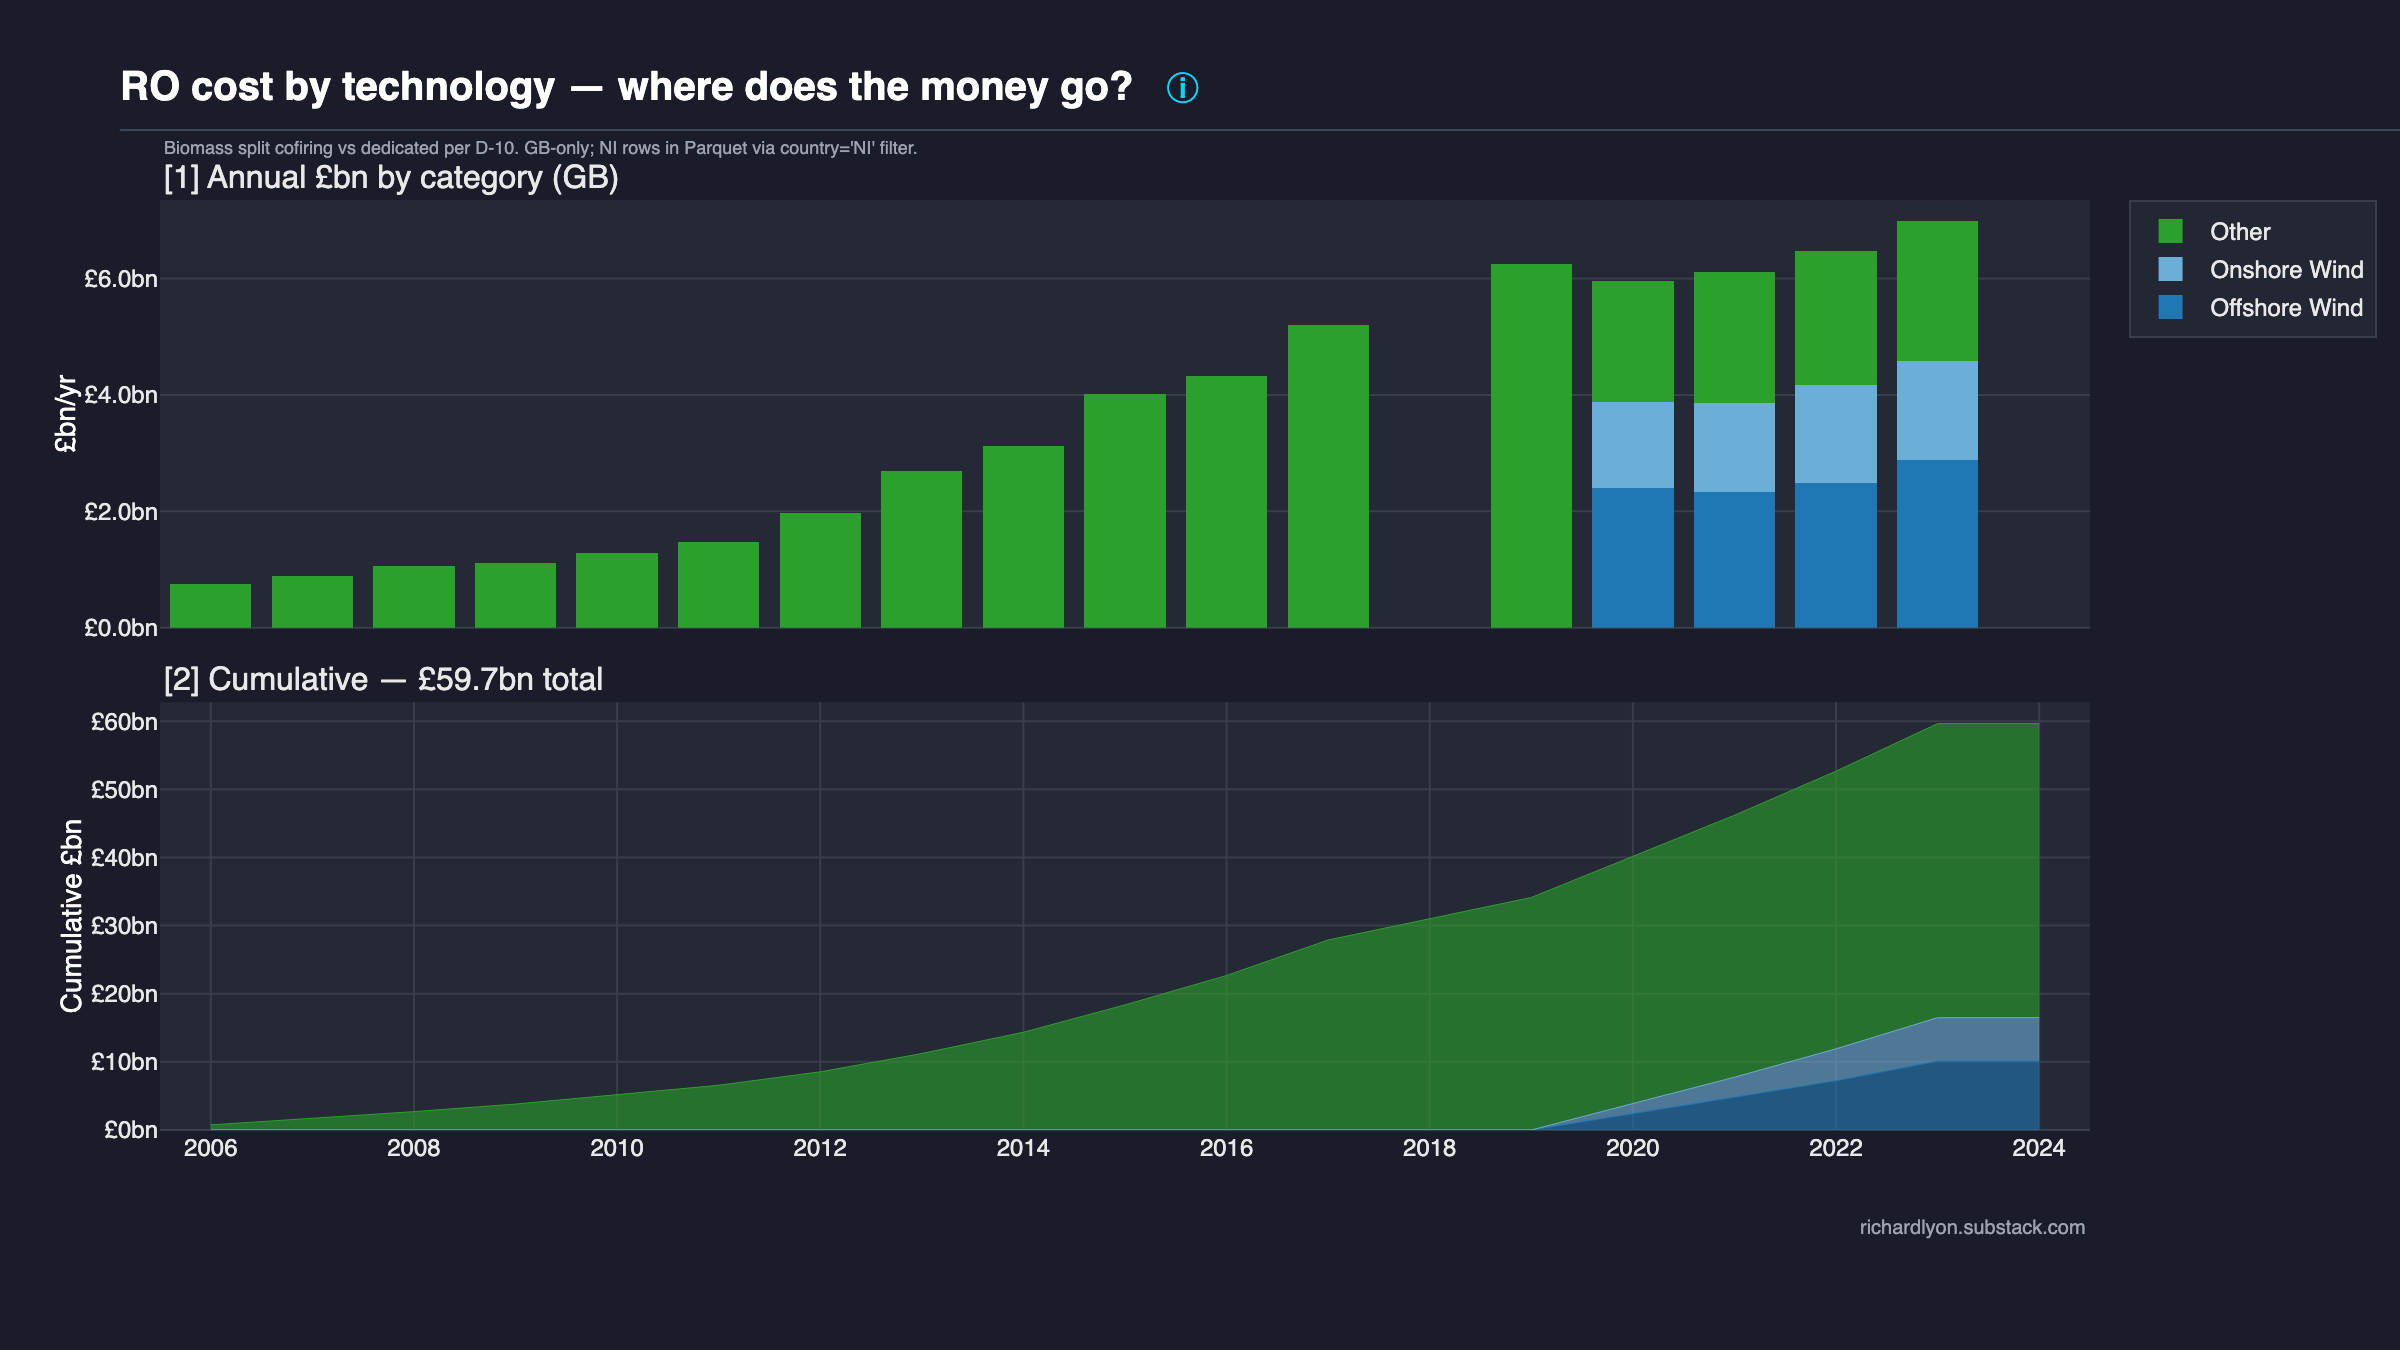
Top contributors over the scheme's lifetime (GB-only):
- Offshore wind — largest single technology by cumulative cost; 2.0 ROCs/MWh during most of the build-out phase combined with high capacity factors and large fleet additions 2013-2017 produces the dominant share.
- Onshore wind — lower per-MWh cost (0.9 ROCs/MWh in the 2013-2017 banding window) but high cumulative volume from a fleet that grew throughout 2002-2017.
- Biomass (dedicated / conversion) — concentrated at Drax (coal-to-biomass conversion post-2013, ~1.0 ROCs/MWh) and Lynemouth. A small number of stations driving a large share of cost is the canonical concentration story.
- Biomass (co-firing) — pre-2013 period dominated by coal-plant co-firing ROCs at 0.5 ROCs/MWh.
- Solar PV — significant post-2013 ground-mounted deployment; lower per-MWh cost than wind but high installed capacity in the 2013-2017 boom.
The full per-technology, per-year breakdown is in data/derived/ro/by_technology.parquet — the published interactive chart shows the top six categories, but every technology surfaces in the source Parquet.
The pre-2013 vs post-2013 distinction also matters. Before the 2013 banding review, several technologies received generous bandings that were later cut sharply: solar PV bandings dropped from 2.0 to 1.4 (then 1.2) ROCs/MWh; co-fired biomass dropped from 0.5 to 0.3 (then phased out by 2016). Post-2013 commissioning therefore receives substantially less per-MWh subsidy than pre-2013 commissioning of the same technology.
Concentration (Chart S4)¶
S4 Concentration — DEFERRED: data-gated
Station-level concentration analysis (Lorenz curve, top-N attribution) requires per-station ROC-issuance data that is no longer publicly downloadable. See §7 Data access for the full timeline and unlock paths.
Forward commitment (Chart S5)¶
S5 Forward commitment — DEFERRED: data-gated
Per-station accreditation-end projections to the 2037 scheme close require the station register (accreditation-date + 20-year window). See §7 Data access.
Methodology¶
- Primary cost: computed from
rocs_issued × buyout_gbp_per_roc + recycle_gbp_per_rocfor the obligation year, with mutualisation adjustments for SY21-SY22 only (£44.0M redistributed; £119.7M scheme-wide shortfall). - Gas counterfactual: shared with CfD. See gas-counterfactual methodology.
- Scope: GB-only headline; NI rows structurally preserved in Parquet but null-valued under aggregate grain. NIRO is administered separately by Ofgem NI with distinct buyout prices and bandings.
- Calendar year axis: aggregation uses scheme-year-start calendar year (SY18 2019-20 → year=2019); obligation_end_year preserved in the Parquet for ROC-price joins. Charts use calendar years.
- Methodology version:
counterfactual.METHODOLOGY_VERSION = "0.1.0"stamped on every derived Parquet row. - Benchmark: reconciled against REF Constable 2025 Table 1 via
tests/test_benchmarks.py::test_ref_constable_ro_reconciliation— reconstruction totals fall within ±3% per scheme year of REF's published figures (on covered years). - Coverage: the reconstructed £58.6 bn headline covers scheme years SY5-SY16 (2006-2017) and SY18-SY22 (2019-2023). SY1-SY4 (2002-2005) and SY17 (2018) are deferred-data-gated (see Data access).
The 2013 banding review — why pre-2013 vs post-2013 matters¶
DECC ran a major banding review concluded in April 2013. The headline reductions:
- Co-fired biomass: reduced from 0.5 to 0.3 ROCs/MWh, with a further phase-out by 2016.
- Solar PV: reduced from 2.0 to 1.4 (then 1.2) ROCs/MWh for ground-mount installations.
- Onshore wind: reduced from 1.0 to 0.9 ROCs/MWh.
- Offshore wind: held at 2.0 ROCs/MWh for projects commissioned through March 2017.
- Dedicated biomass conversion: held at 1.0 ROCs/MWh.
The banding review created a strong incentive to commission before the cut-off. The 2014-2016 build-out years are visibly lumpier in the by-technology chart as developers raced to lock in the higher pre-cut bandings.
The 2021-22 mutualisation event — what happened and why it matters¶
In the autumn-winter 2021-22 energy price crisis, 30 UK retail energy suppliers failed. Some of those failures occurred mid-way through the RO scheme year (April 2021 - March 2022), which meant the failed suppliers had received supply revenue from consumers but had not yet presented their ROC quota or paid the buy-out fee. Ofgem's mutualisation mechanism socialises that shortfall across the surviving suppliers.
For SY 2021-22:
- Total shortfall: £119.7 M of unpresented ROC obligations from failed suppliers.
- Mutualisation triggered: the shortfall exceeded the published mutualisation threshold for the year.
- Redistributed to ROC-holders: £44.0 M paid out by Ofgem in December 2022.
The 2022-23 scheme year saw a £7.2 M shortfall, well below the ~£318 M mutualisation ceiling for the year, and no mutualisation was triggered. As of the 2026-04 site refresh, 2021-22 is the only RO scheme year in which mutualisation has fired.
Methodology caveats — what this page does not adjust for¶
- Embedded VAT. The headline figure is the wholesale RO levy; consumers also pay VAT on energy bills.
- Cost-recovery distribution. Suppliers may not pass the full ROC cost through immediately; some is absorbed into commodity hedges and timing differences. The figures here are the regulator-published RO levy paid by suppliers.
- Generator-side counterfactual returns. The "avoided gas cost" counterfactual answers what would have been paid for the same MWh from the existing CCGT fleet. It does not answer whether those MWh would have existed in a counterfactual world.
- Scope of NIRO exclusion. GB-only headline excludes Northern Ireland. UK-total reconstruction is one filter away in the Parquet.
Data access¶
On 2025-05-14 Ofgem's Public Reports Dashboard was withdrawn. Station-level ROC issuance and the station register are now accessible only via rer.ofgem.gov.uk, which requires SharePoint-OIDC authentication. This section documents how the scheme total is reconstructed from the publicly-downloadable alternatives Ofgem continues to publish.
What remains publicly downloadable (no authentication required):
- The 12-year aggregate XLSX:
rocs_report_2006_to_2018_20250410081520.xlsx(last modified 2025-05-21; 3 sheets, GB aggregate by technology × month × country). This is the authoritative source for scheme years SY5-SY16 (April 2006 – March 2018). - Six machine-readable annual-report XLSX dataset companions covering scheme years SY18 through SY23 (one XLSX per scheme year, hosted on
ofgem.gov.ukunder/sites/default/files/; URL inventory insrc/uk_subsidy_tracker/data/ofgem_aggregate.py). - The Ofgem RO public reports landing page — the annual-report PDF index.
- Individual annual-report PDFs (latest: SY23-24).
What is SharePoint-OIDC gated (deferred):
- The station register (accreditation dates + 20-year support windows, required for the S5 forward-projection chart).
- Monthly per-station ROC issuance (required for the S4 concentration analysis).
Deferred scheme years:
- SY1-SY4 (2002-2005): no Ofgem-published machine-readable aggregate found for these years. ROC prices for these years are absent from the pipeline's
roc-prices.csv; cost rows carry NaN. - SY17 (2018-19): annual report published as PDF only (no XLSX dataset companion). Machine-readable aggregate absent from both the 12-year XLSX (which ends March 2018) and the SY18-SY23 annual-report XLSX series.
The deferred years account for the gap between the reconstructed £58.6 bn and independent published estimates for the full 2002-2024 period.
Unlock paths:
Station-level charts S4 and S5 are deferred pending either (a) a future collaboration with an independent analyst holding station-level data, or (b) a future credentialed-access implementation for rer.ofgem.gov.uk.
Corrections and additional data sources welcome — see corrections or file a GitHub issue with the correction label.
Data & code (GOV-01 four-way coverage)¶
-
Primary source — Ofgem 12-year aggregate XLSX (SY5-SY16); Ofgem RO annual-report XLSX dataset companions SY18-SY23; ONS System Average Price of gas (gas counterfactual fuel cost); UK ETS auction results (carbon-price overlay).
-
Chart source code —
plotting/subsidy/ro_dynamics.py,ro_by_technology.py. (S4 and S5 chart modules dormant — see §7 Data access.) -
Pipeline source code —
schemes/ro/(the five §6.1 contract functions),schemes/ro/aggregate_model.py(aggregate-grain pipeline),counterfactual.py(gas counterfactual formula shared with CfD),data/ofgem_aggregate.py(Ofgem aggregate loader). -
Test —
tests/test_benchmarks.py::test_ref_constable_ro_reconciliation— ±3% per scheme year tolerance against REF Constable 2025 Table 1, parametrised over 22 scheme years.tests/test_docs_ro_headline_sync.py— prose headline matchesannual_summary.parquetGB total to 1 decimal place. -
Reproduce:
git clone https://github.com/richardjlyon/uk-subsidy-tracker
cd uk-subsidy-tracker
uv sync
uv run python -c "from uk_subsidy_tracker.schemes import ro; ro.refresh(); ro.rebuild_derived()"
uv run python -m uk_subsidy_tracker.plotting
Per-grain derived-data shape¶
| Grain | Rows (typical) | Key columns | Used by chart |
|---|---|---|---|
annual_summary.parquet |
~25 (per country) | year, country, ro_cost_gbp, ro_cost_gbp_eroc, mutualisation_gbp |
S2 dynamics |
by_technology.parquet |
~150 | year, technology, country, ro_cost_gbp, ro_generation_mwh |
S3 by-technology |
Each grain has a sibling *.schema.json documenting column types, nullability, and the embedded methodology_version field. Station-level grains (station_month, by_allocation_round, forward_projection) are dormant pending data-access unlock — see Data access.
Headline FAQ¶
Q: Why is the headline £58.6 bn rather than published estimates in the £65-70 bn range?
A: The reconstructed £58.6 bn covers only scheme years for which Ofgem has published machine-readable aggregate data (SY5-SY16 and SY18-SY22). Scheme years SY1-SY4 (2002-2005, approximately £1.8 bn) and SY17 (2018-19, approximately £5.9 bn) are absent from publicly-downloadable aggregates and are deferred. Including them would bring the total into the £65-70 bn range consistent with published estimates. The pipeline emits NaN for these years rather than filling from PDF-transcription estimates, because reproducibility requires a machine-readable primary source. See Data access.
Q: Why is the £58.6 bn figure computed from a reconstruction rather than cited from a single source?
A: Reproducibility. Under the project's core value ("every headline number reproducible from git clone + uv sync + one command"), every pound must trace through the repository's transformation chain rather than be cited from a PDF. The reconstructed figure is independently validated against REF Constable 2025 Table 1 per scheme year (±3% tolerance on covered years, enforced as a CI hard-block by tests/test_benchmarks.py::test_ref_constable_ro_reconciliation).
Q: Is £58.6 bn the only figure that matters?
No. Three other numbers carry comparable weight: the annual current-year RO levy (~£6 bn/yr), the forward-committed total to 2037 (deferred — see Data access), and the per-MWh premium (chart S2 panel 3). The headline FAQ exists because no single number captures all three readings of "what does the RO cost".
Q: Why pick GB-only rather than UK-total as the headline?
Three reasons. First, NIRO is administered separately by Ofgem NI under distinct rules; mixing the two in a headline conflates regulatory regimes. Second, most reader mental models of "the UK" in energy-policy contexts default to GB. Third, the published Parquet carries country='NI' rows so the UK-total reconstruction is a one-line filter — the GB headline is not a hidden total, just a deliberately scoped one.
Q: How is this different from REF Constable's published RO totals?
REF's annual figures are scheme-year (April-March) on a UK-total basis (incl. NIROC). This site's annual figures are calendar-year on a GB-only basis. Where REF and this site disagree by more than ±3% on a covered scheme year, the test_ref_constable_ro_reconciliation test fails and the divergence must be classified before the phase ships. The convention difference (CY vs SY, GB vs UK) and missing years are the load-bearing distinctions.
See also¶
- Cost theme — cross-scheme subsidy cost comparisons.
- Recipients theme — who receives the subsidies.
- Gas counterfactual — the displaced-gas methodology shared with CfD.
- Citation — how to cite this dataset (CITATION.cff + per-tag snapshot URLs).
- Corrections — the channel for reporting errors in any RO chart, number, or methodology claim on this page.
- Schemes overview — landing page for all per-scheme detail pages.
This page is part of the Schemes section. The structure here — eight sections, GOV-01 four-way coverage at page bottom — is the template for the remaining scheme detail pages (FiT in Phase 7, then constraints / capacity market / balancing / grid / SEG in Phases 8-12).
Last refreshed: see manifest.json generated_at field; daily 06:00 UTC cron.