Reliability
CfD-subsidised wind and solar have multi-week output droughts that no deployed battery can cover. DESNZ's planning capacity-factor assumptions for future CfD rounds are optimistic; the fleet underperforms them today.
Every CfD MWh represents displaced gas — except in the weeks when wind and solar simultaneously collapse. The heatmap below makes those weeks visible with the naked eye: blue stripes across years, especially in winter. The rolling-minimum chart quantifies them: multiple 21-day spans below 20% fleet CF, each longer than any deployable battery can economically bridge. The seasonal capacity-factor chart benchmarks the observed CfD fleet against DESNZ's published AR7 planning assumptions and finds them consistently short.
Charts
-
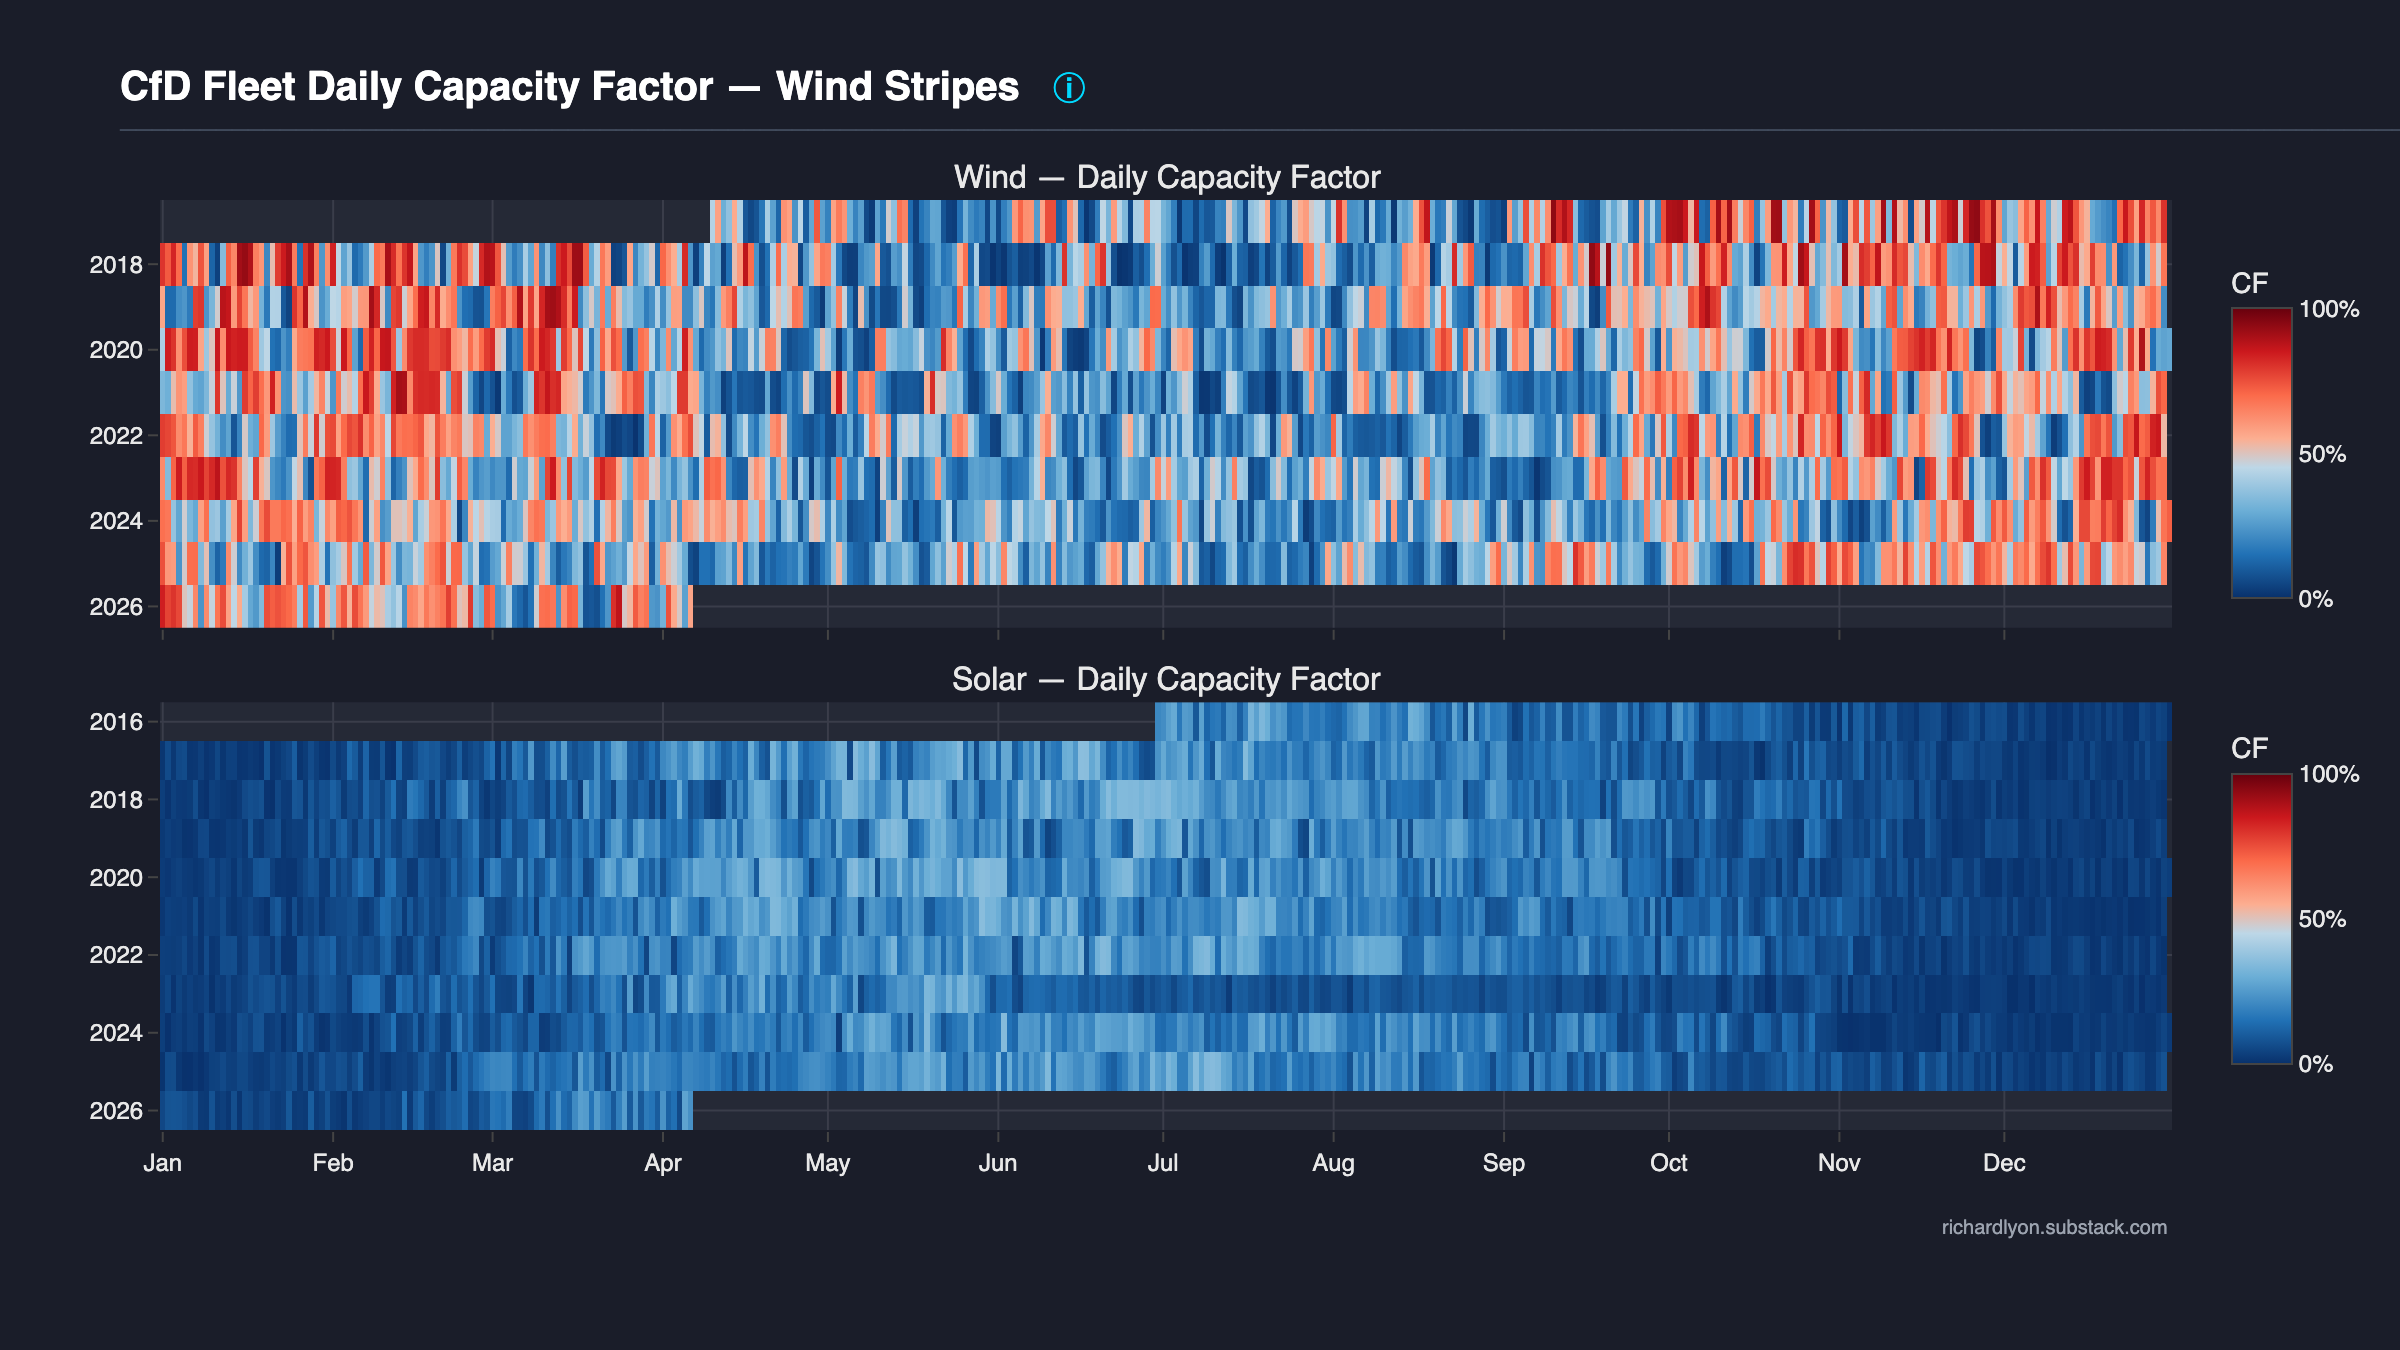
Wind + solar daily capacity factor — year × day-of-year heatmap
Two stacked heatmaps (wind top, solar bottom). Blue stripes are dunkelflaute. You can see every multi-week drought back to 2018.
-
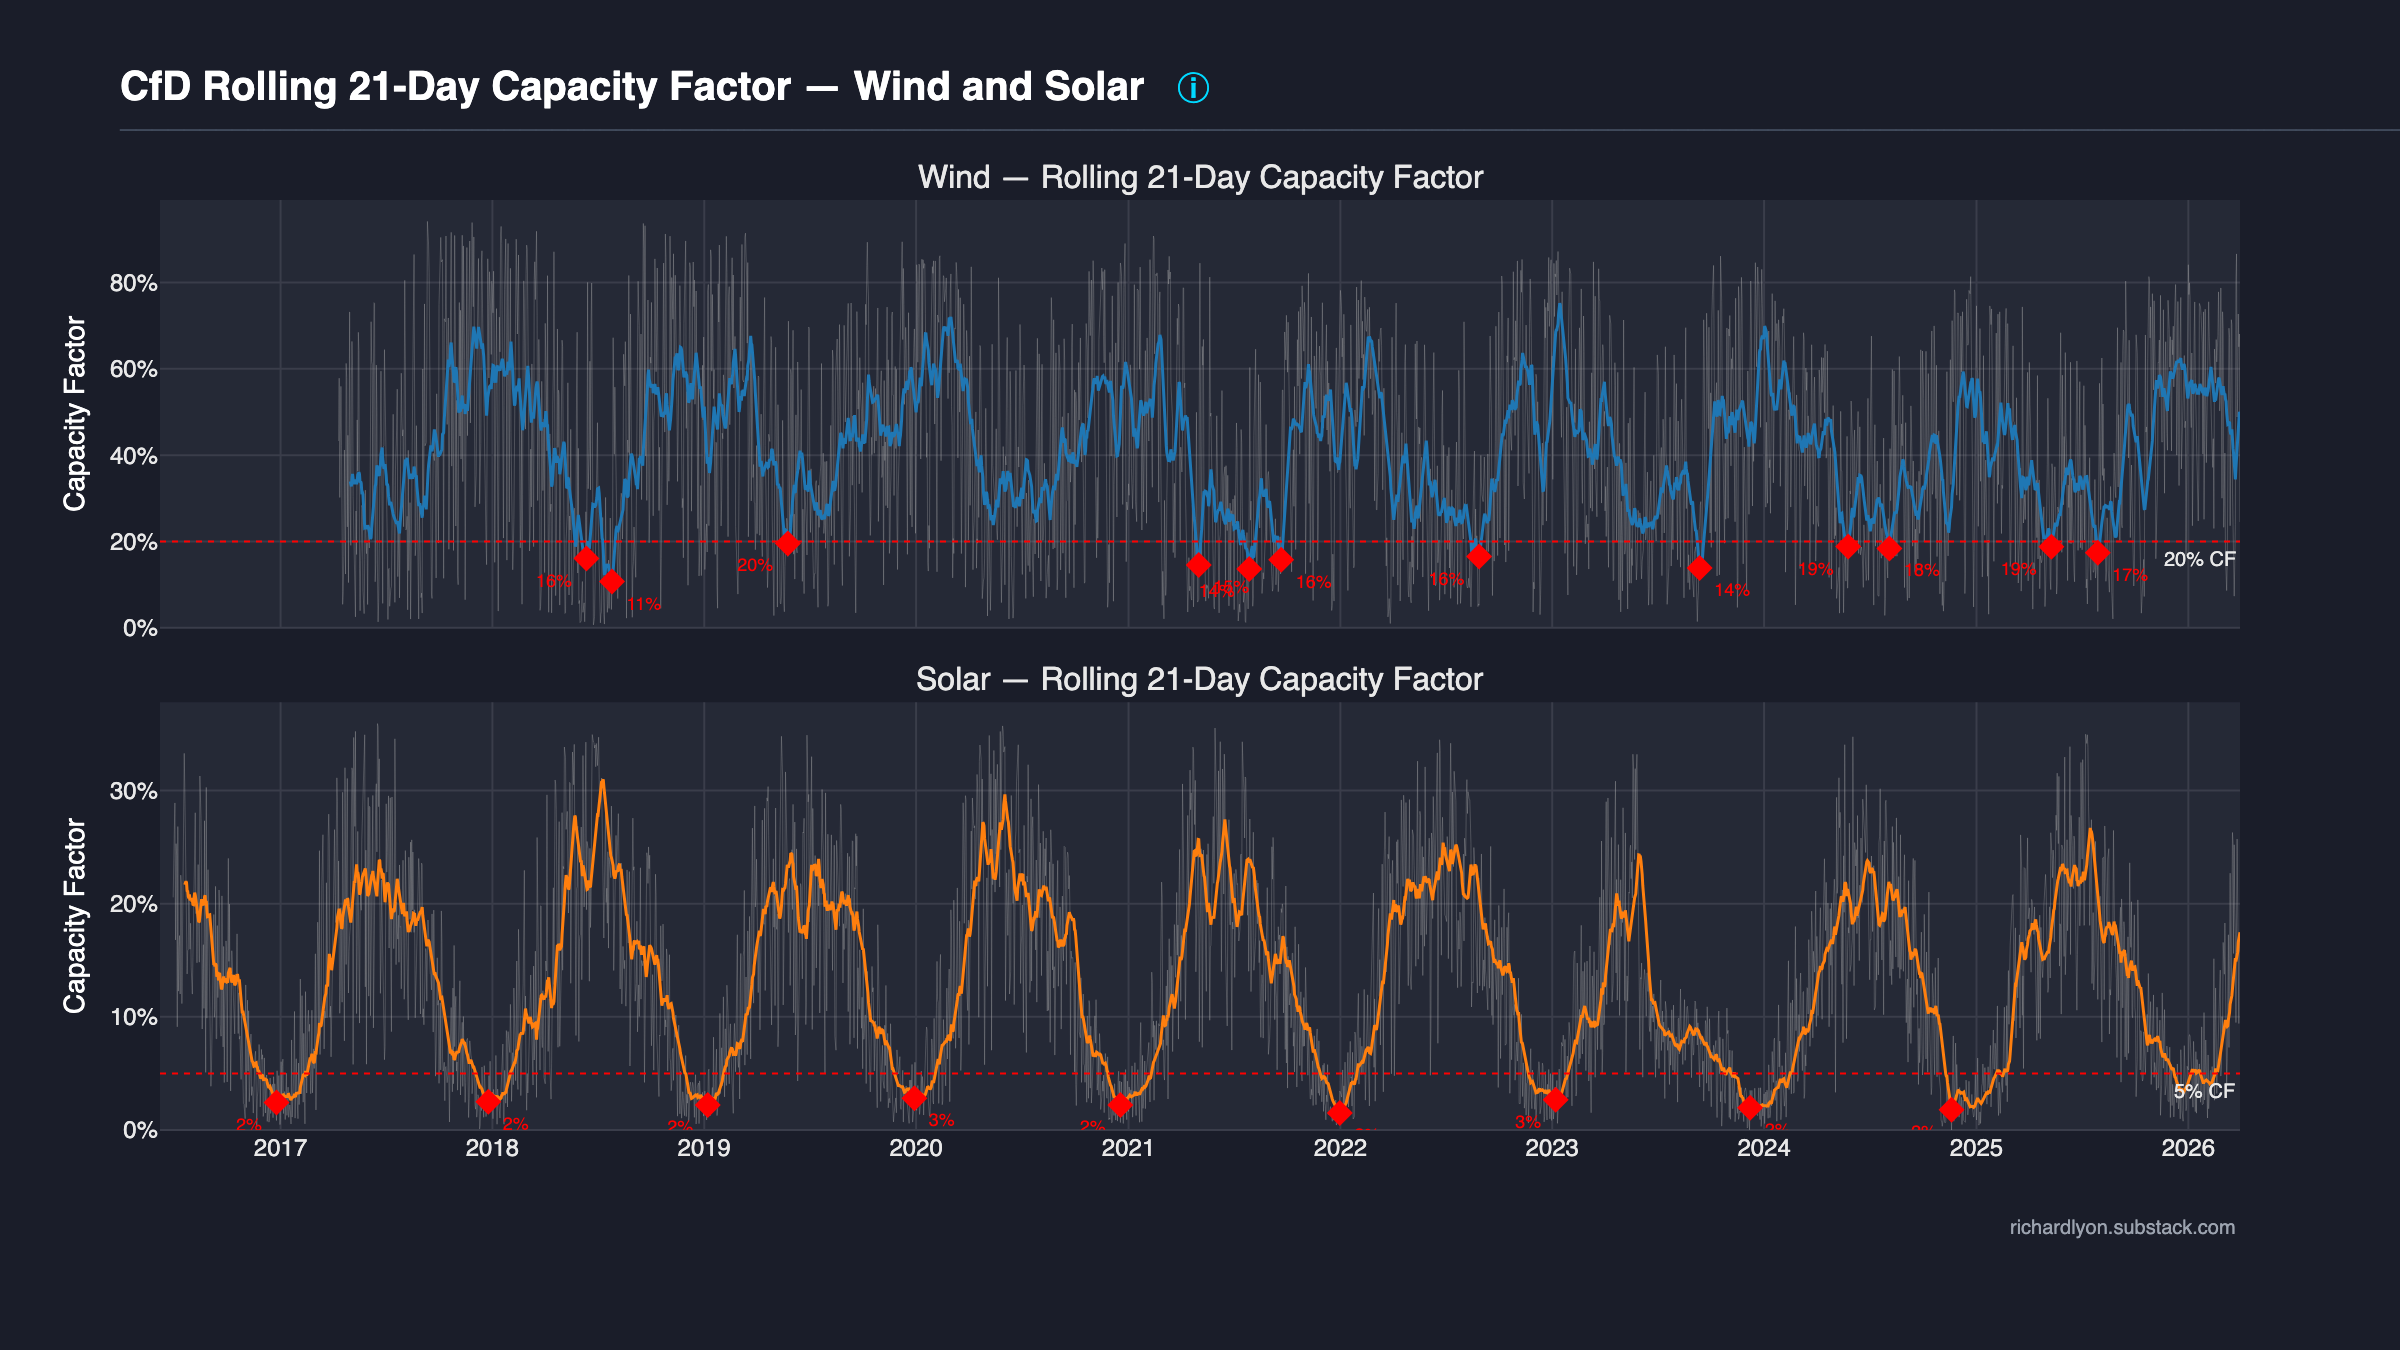
21-day rolling minimum — droughts longer than any battery
Wind and solar 21-day rolling-mean CF with drought troughs flagged. Three weeks of structurally low output is the norm, not a tail event.
-
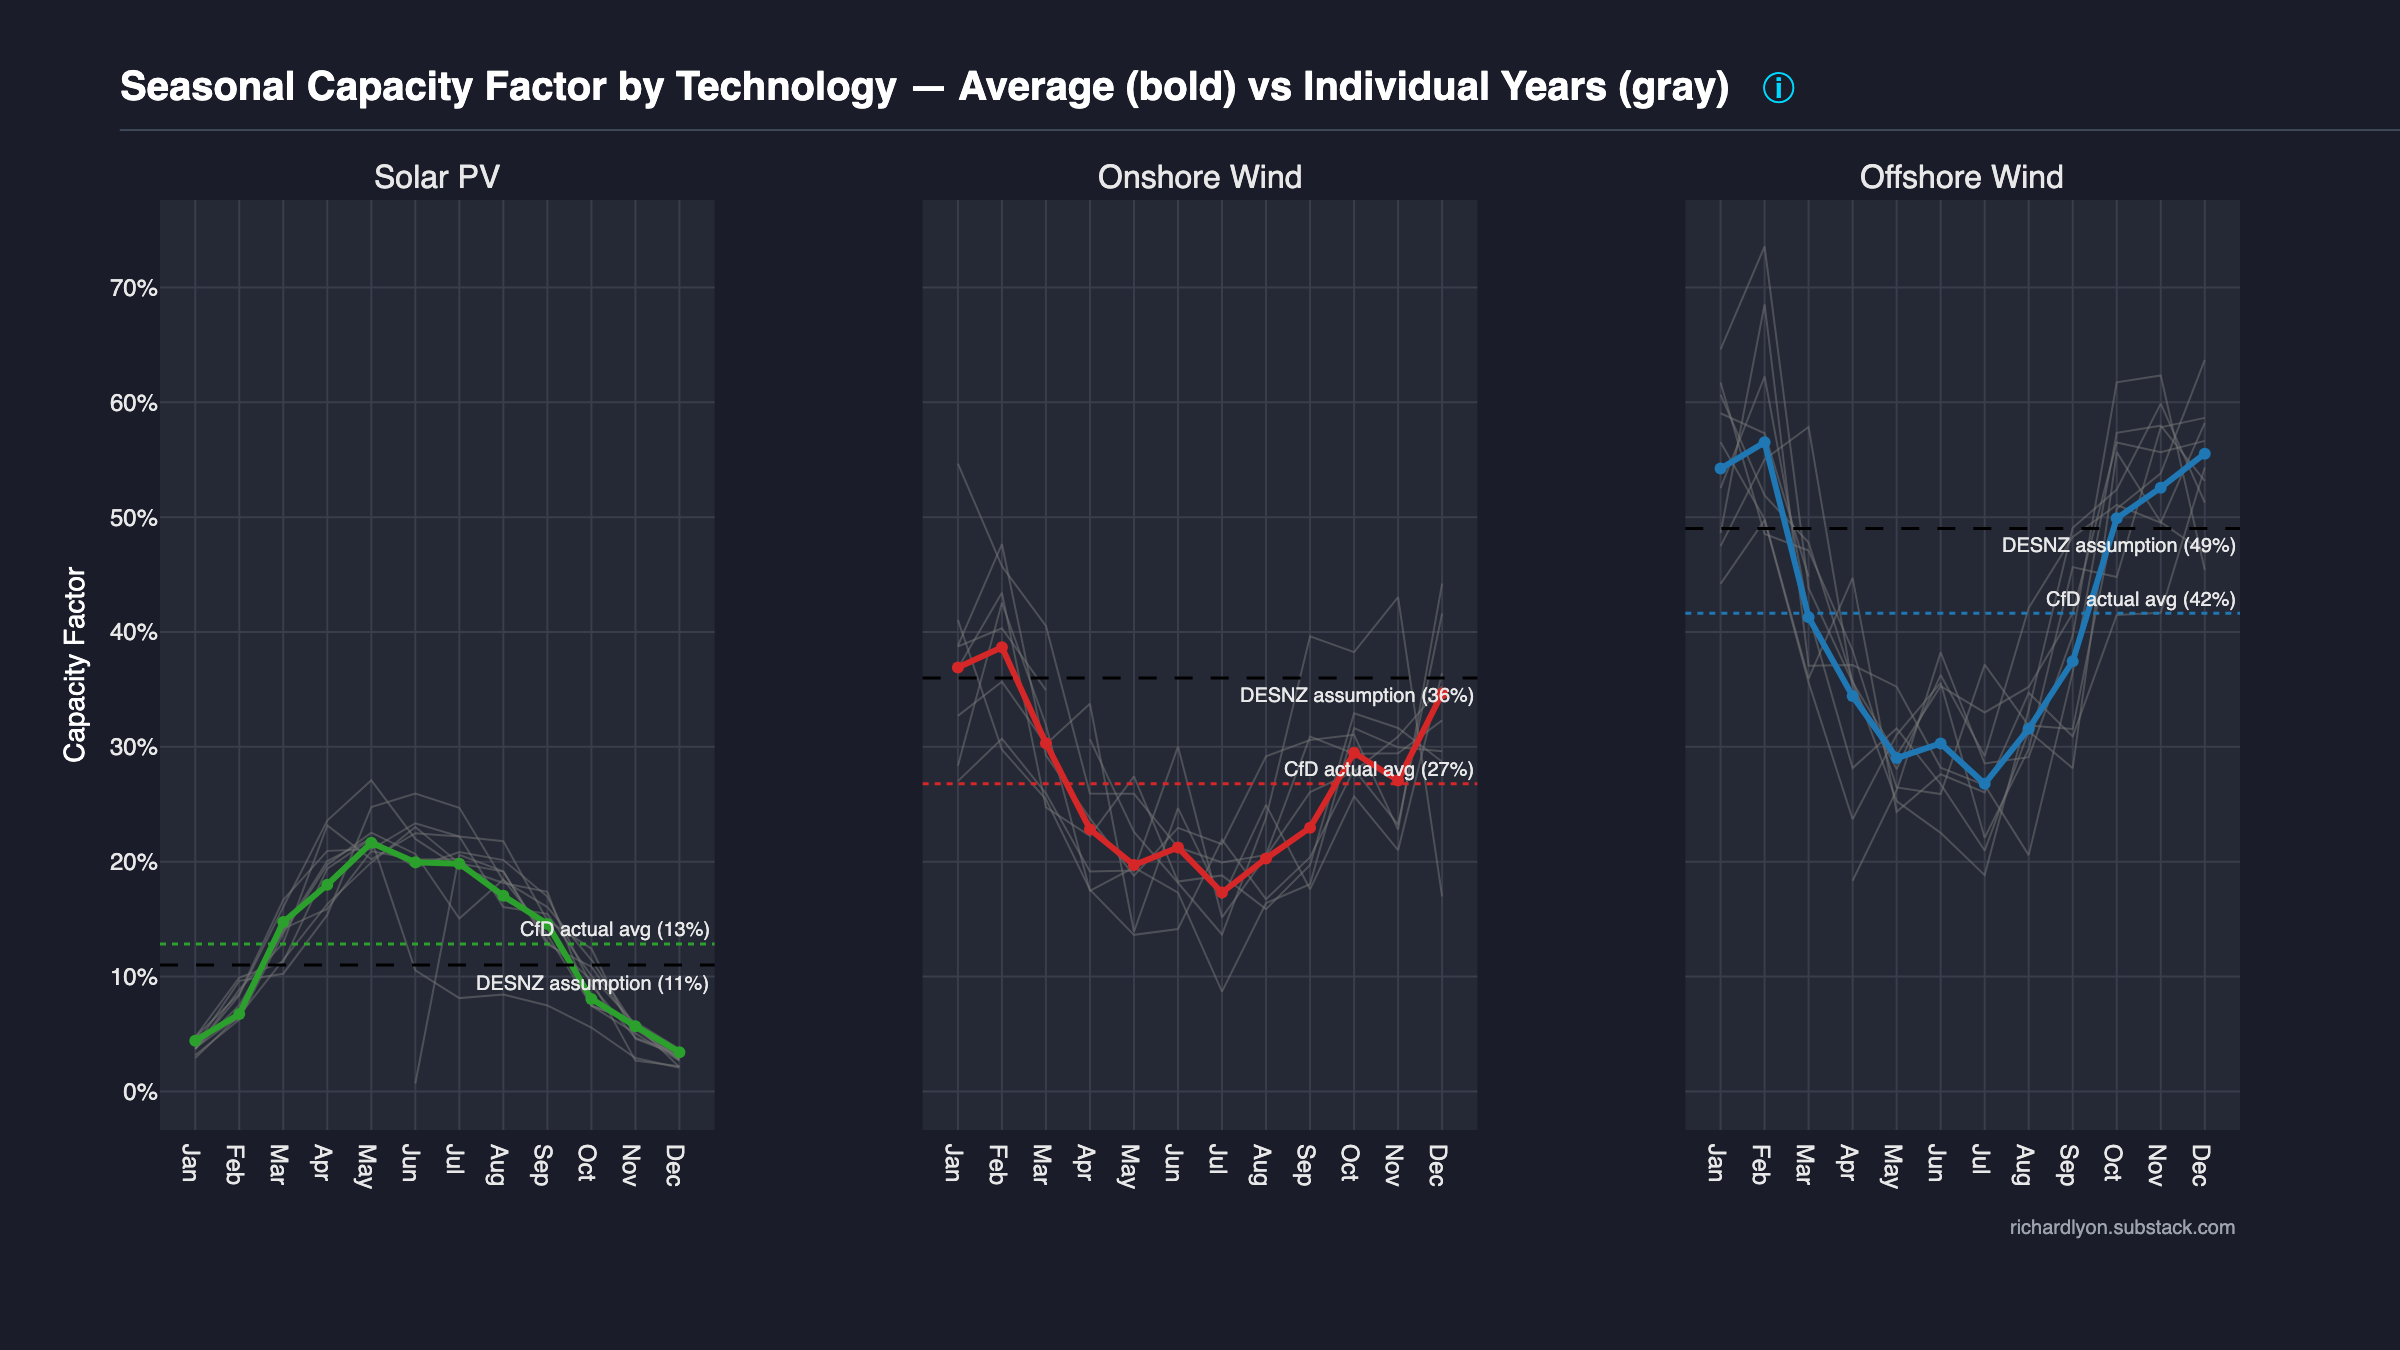
Seasonal capacity factor — observed vs DESNZ assumption
Calendar-month fleet CF by technology, benchmarked against DESNZ's published planning assumptions for new CfD rounds. Fleet sits meaningfully below the headline numbers.
What to look at next
Then → Cannibalisation for what happens in the concentrated output hours, or → Cost for the total spend these reliability caveats apply to.
Methodology
How every number on this page was computed → Reliability methodology.