Cost
Ten years into the scheme, UK consumers have paid £29bn for CfD electricity — roughly £14bn more than the gas fleet would have cost for the same MWh.
The CfD scheme was sold as consumer protection against volatile gas prices. What it produced is a price floor — a guaranteed premium consumers pay every month, in every year of the scheme's operation, including 2022's gas crisis. The charts in this theme decompose that £14bn premium into its three constitutive numbers: the volume of subsidised generation, the per-MWh price gap between strike and the gas alternative, and the cumulative bill.
Charts
-
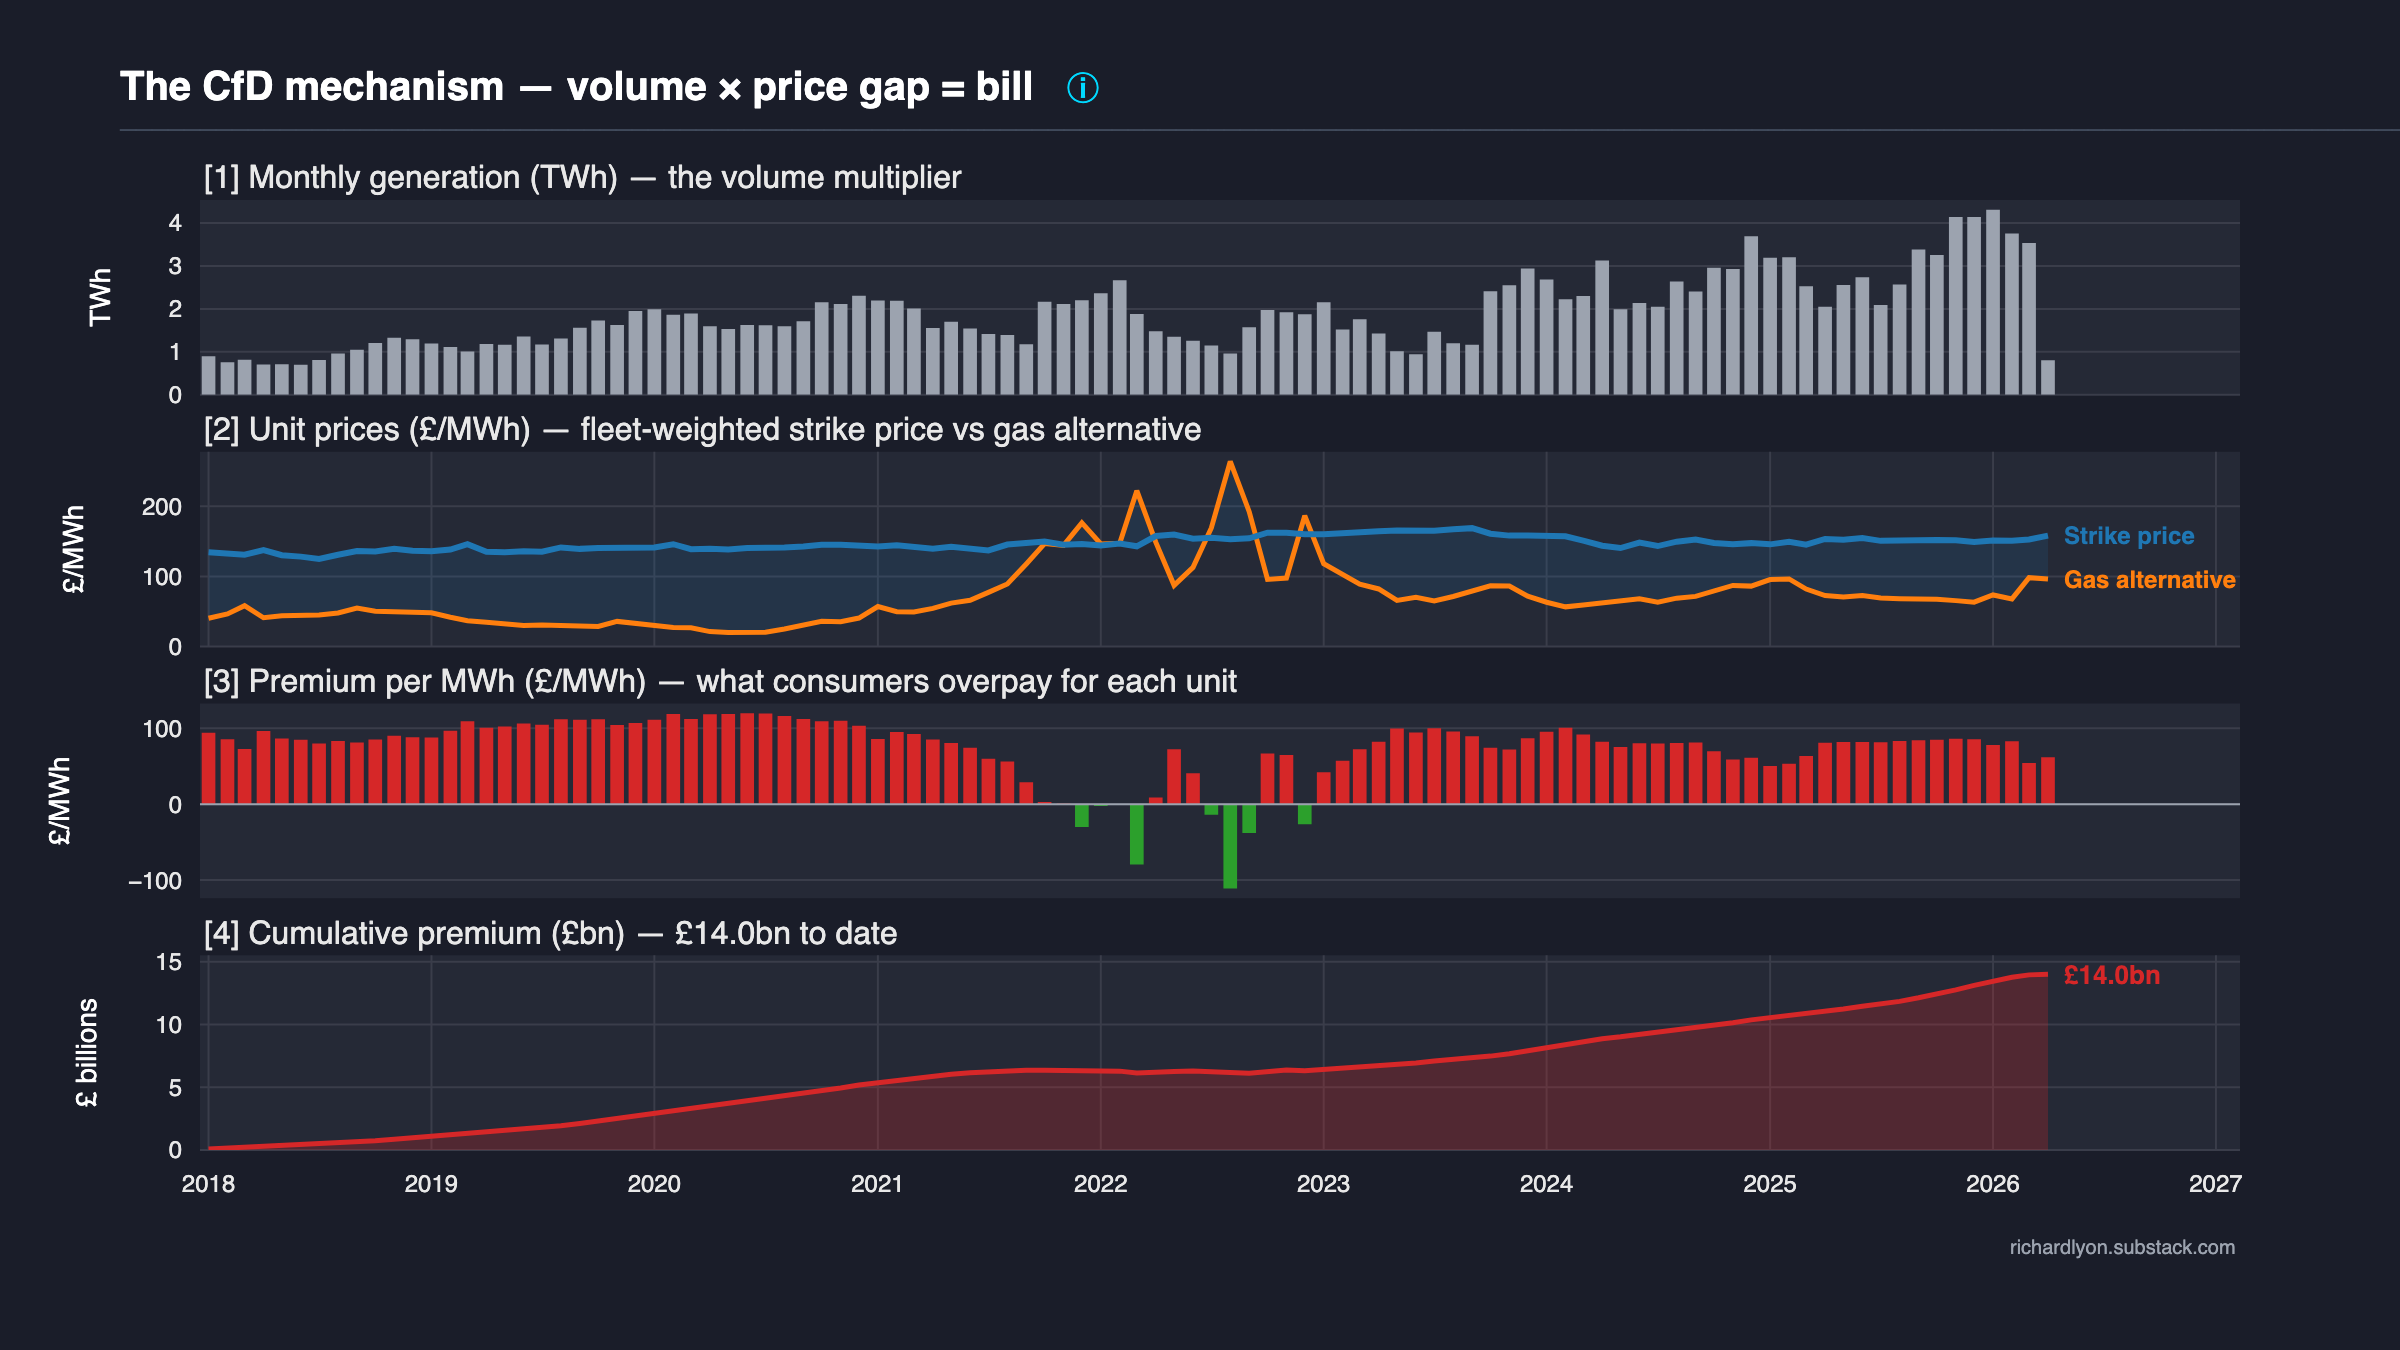
CfD dynamics — the full mechanism in four panels
Volume × price gap = bill. Each panel is a direct consequence of the one above. The diagnostic chart for the whole scheme.
-
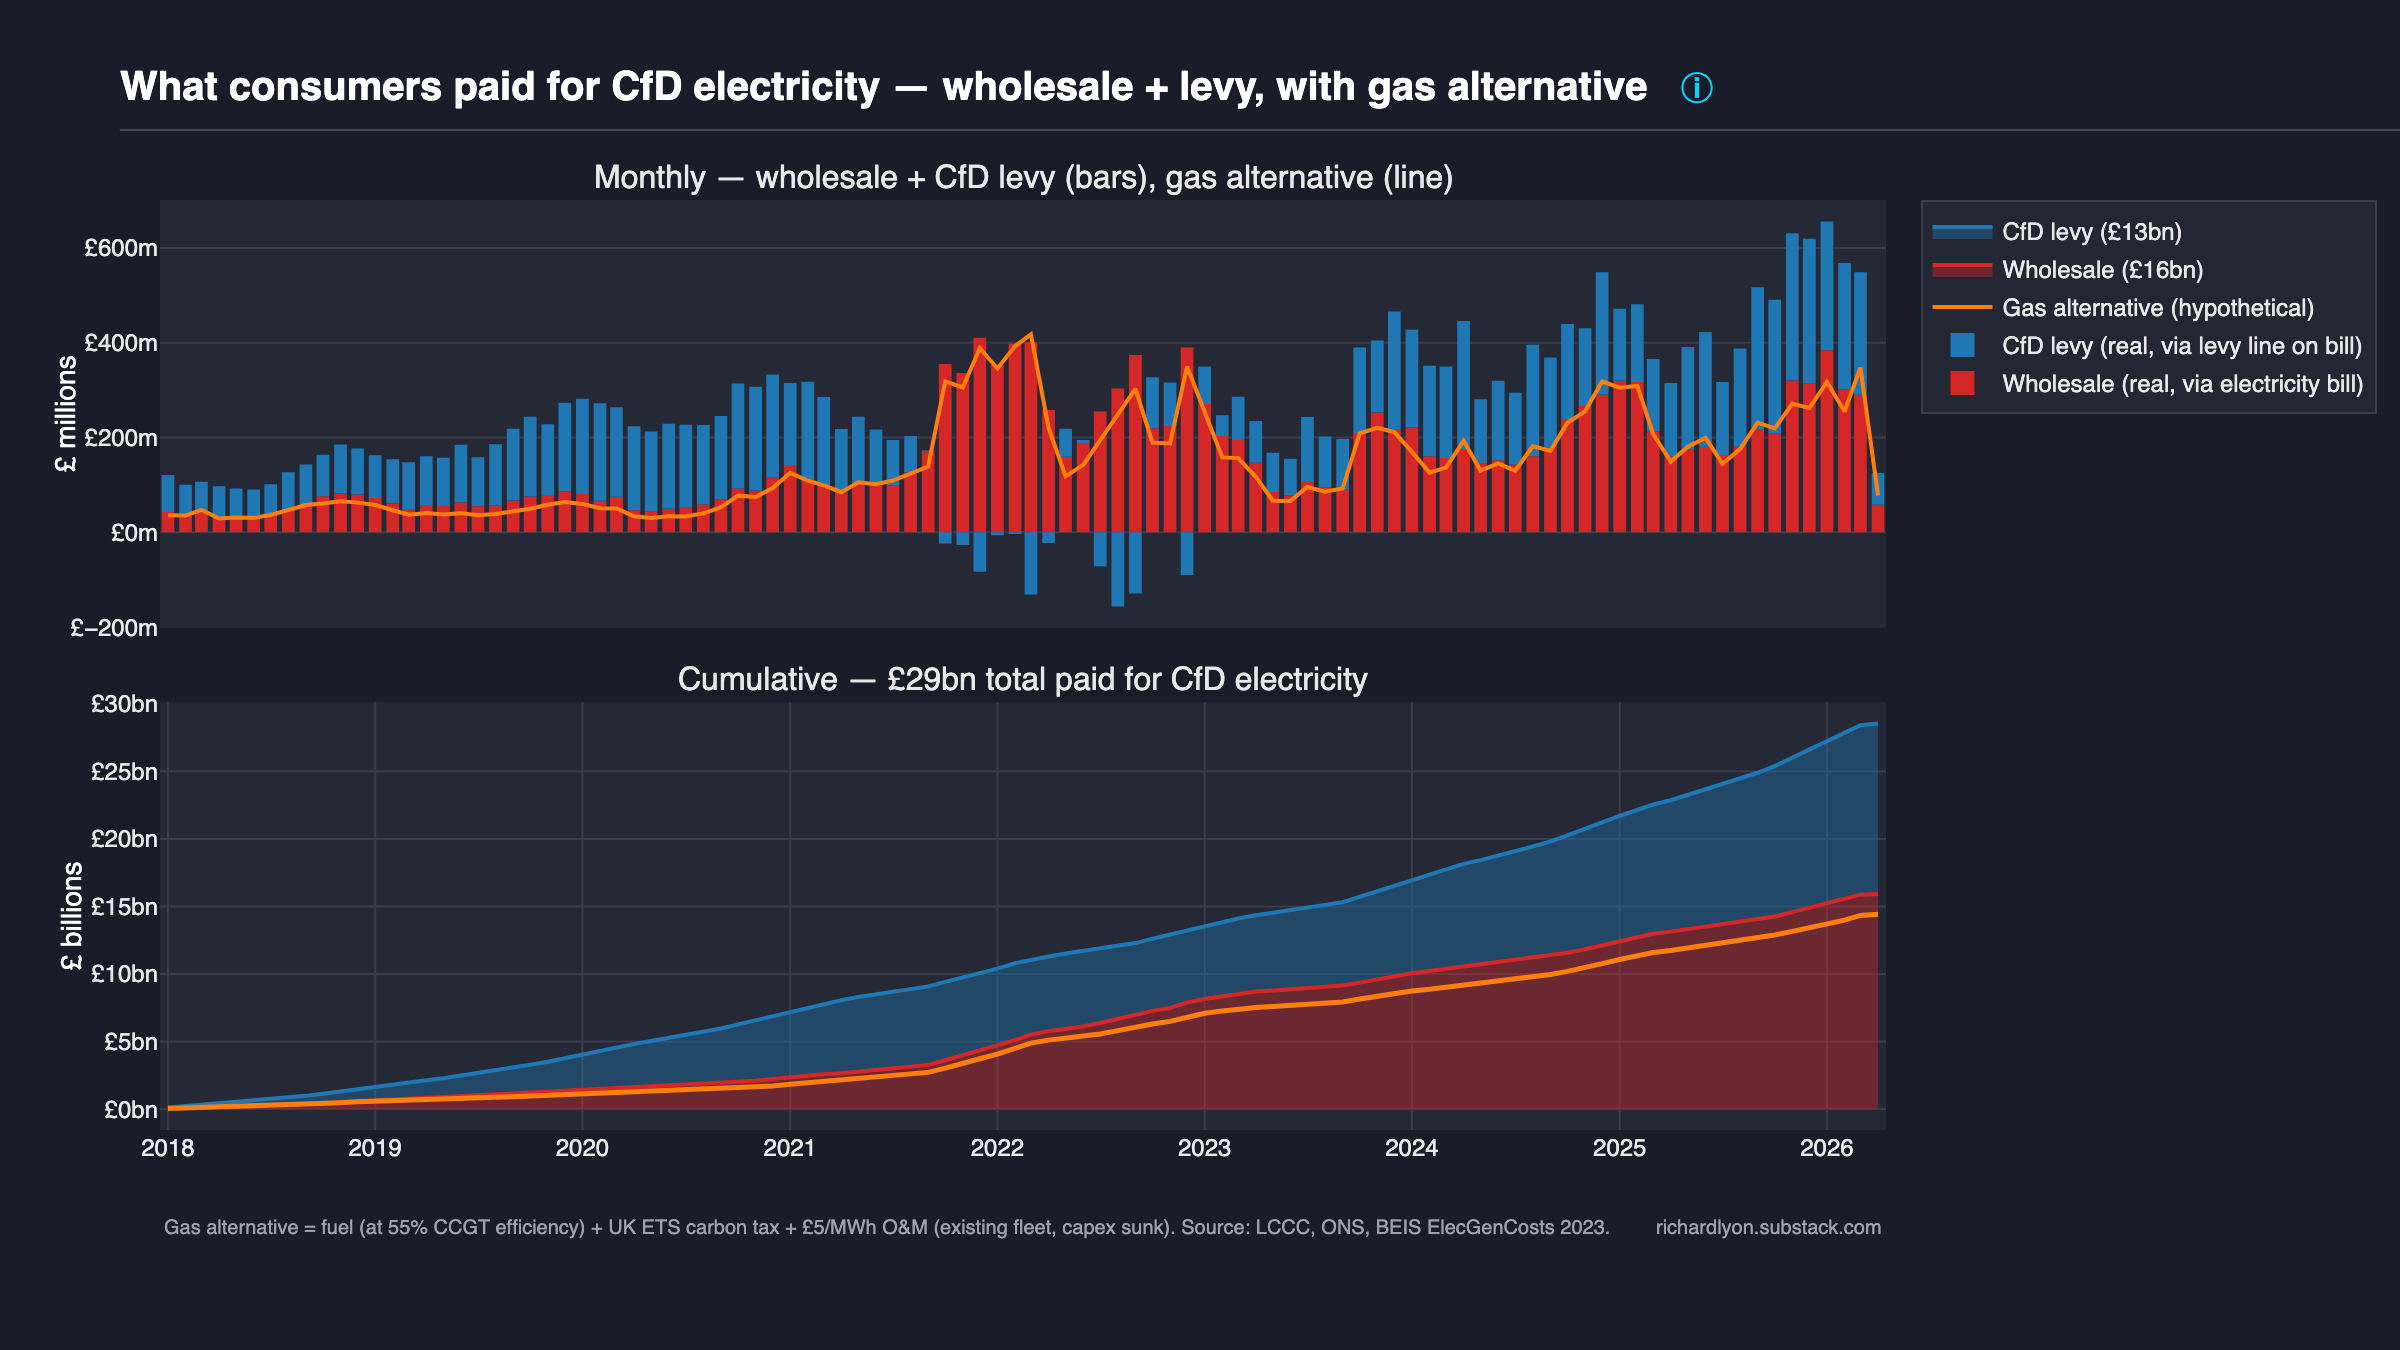
What consumers paid vs what gas would have cost
The same £14bn premium decomposed into the two real cash-flow channels consumers pay through: wholesale and levy.
-
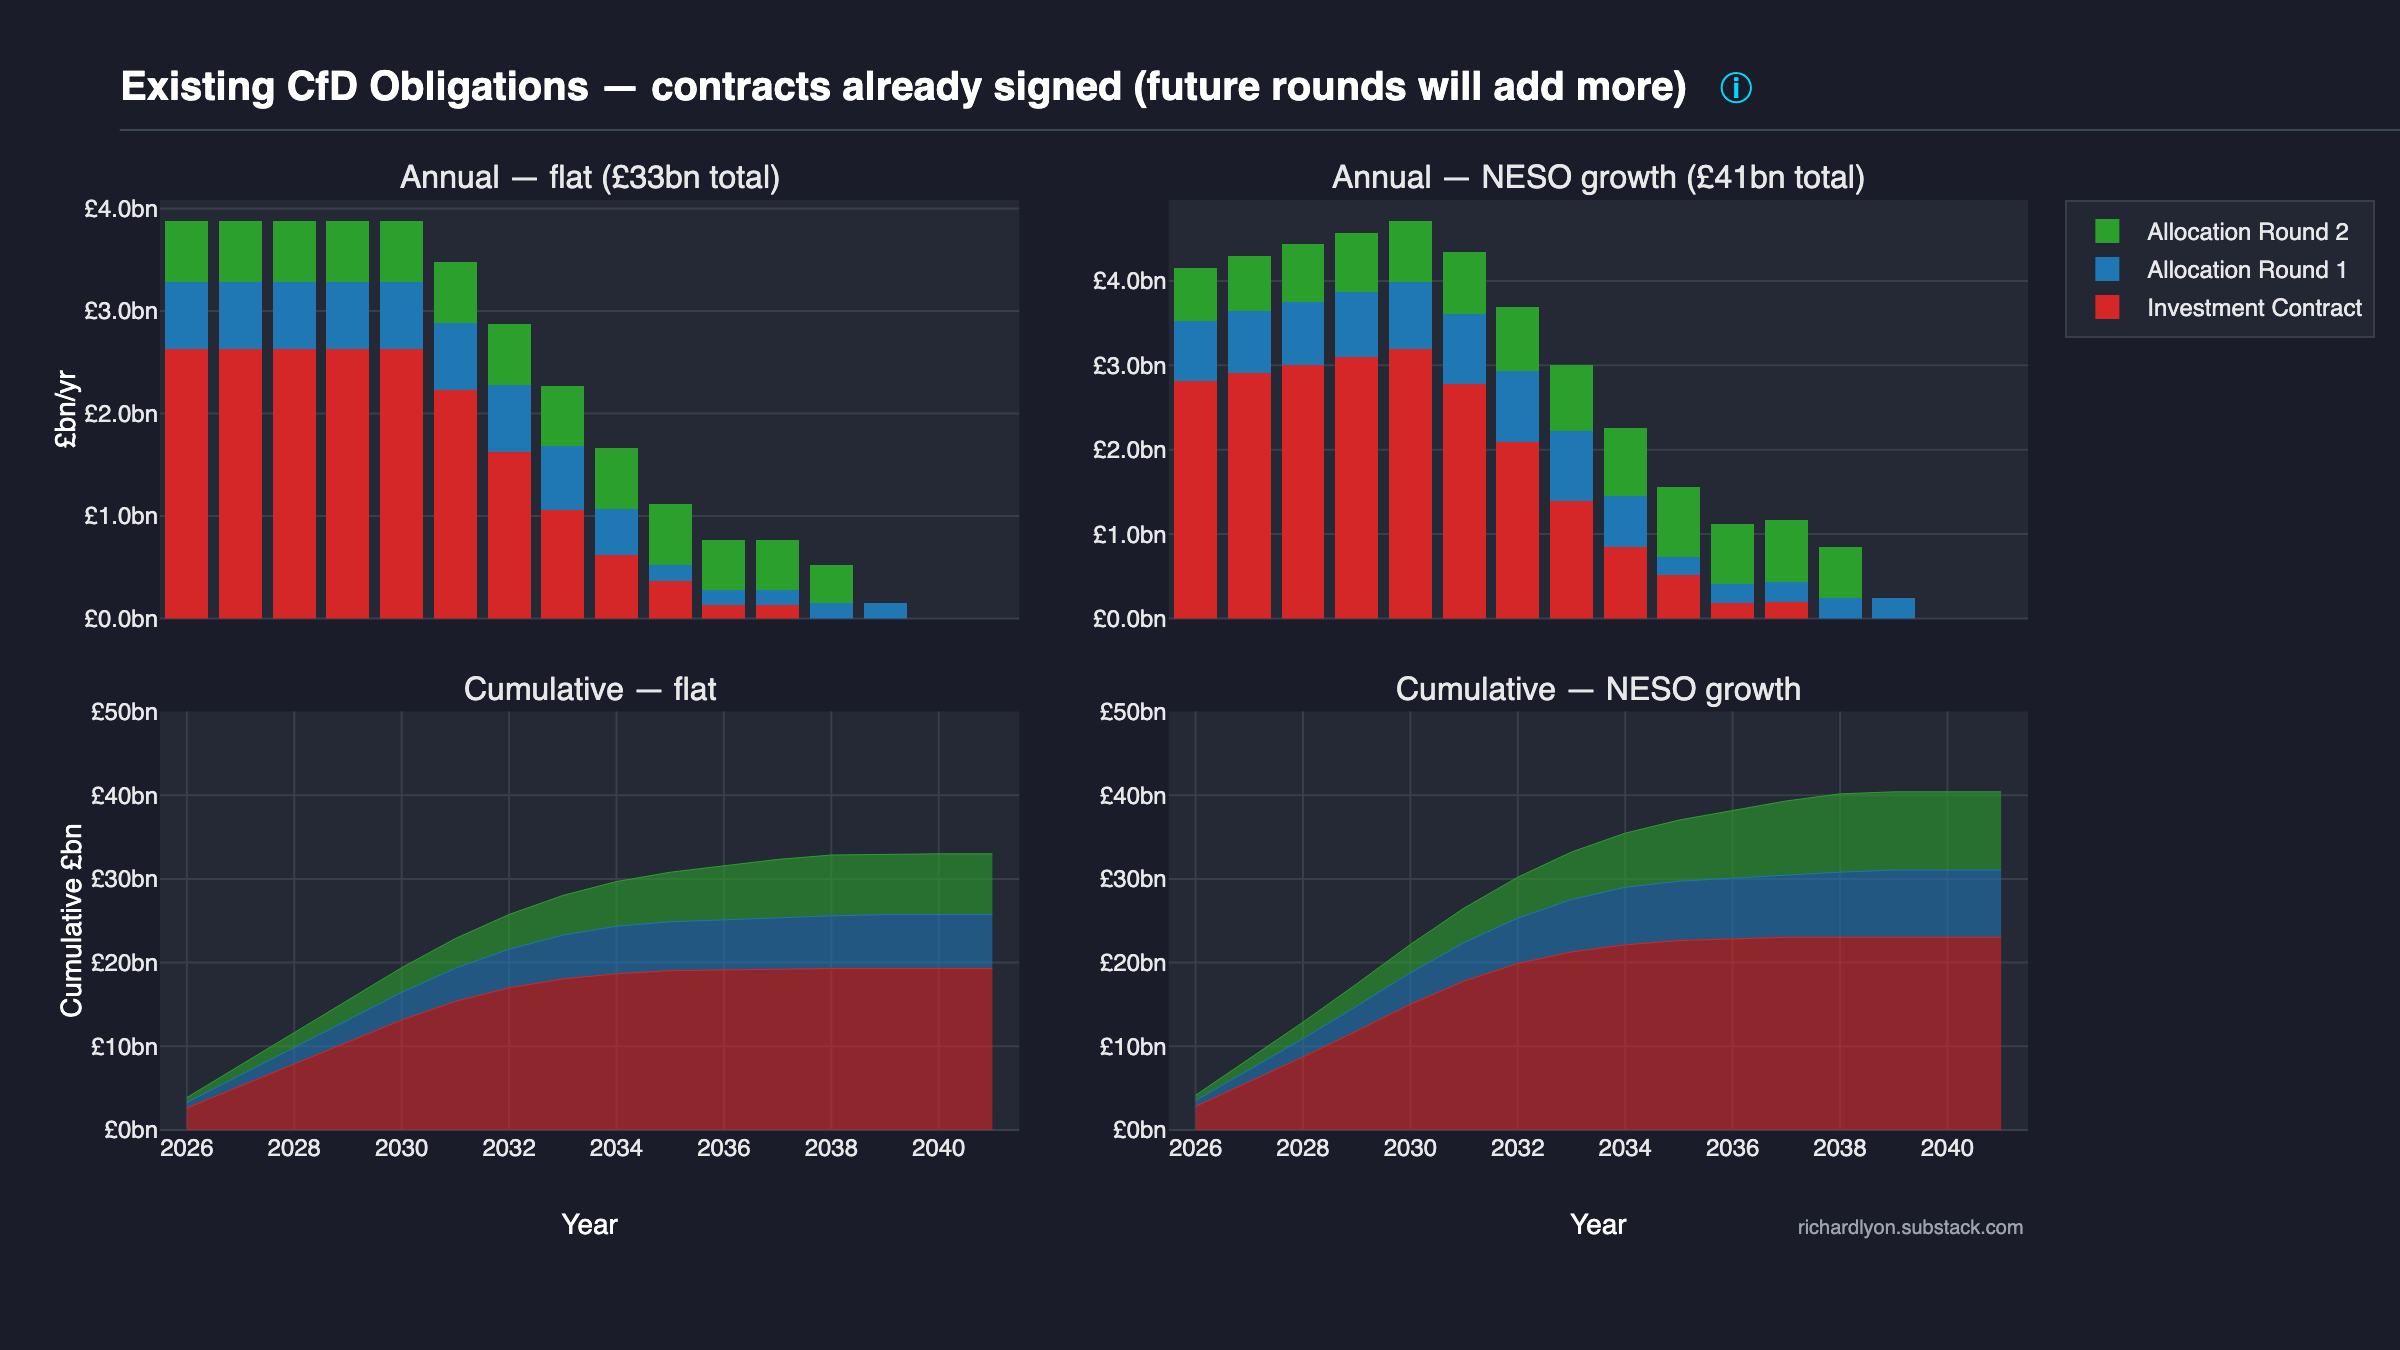
Remaining obligations — what we've already signed for
The contracts already signed will cost another £33bn+. The scheme's bill is largely a forward commitment, not a current choice.
-
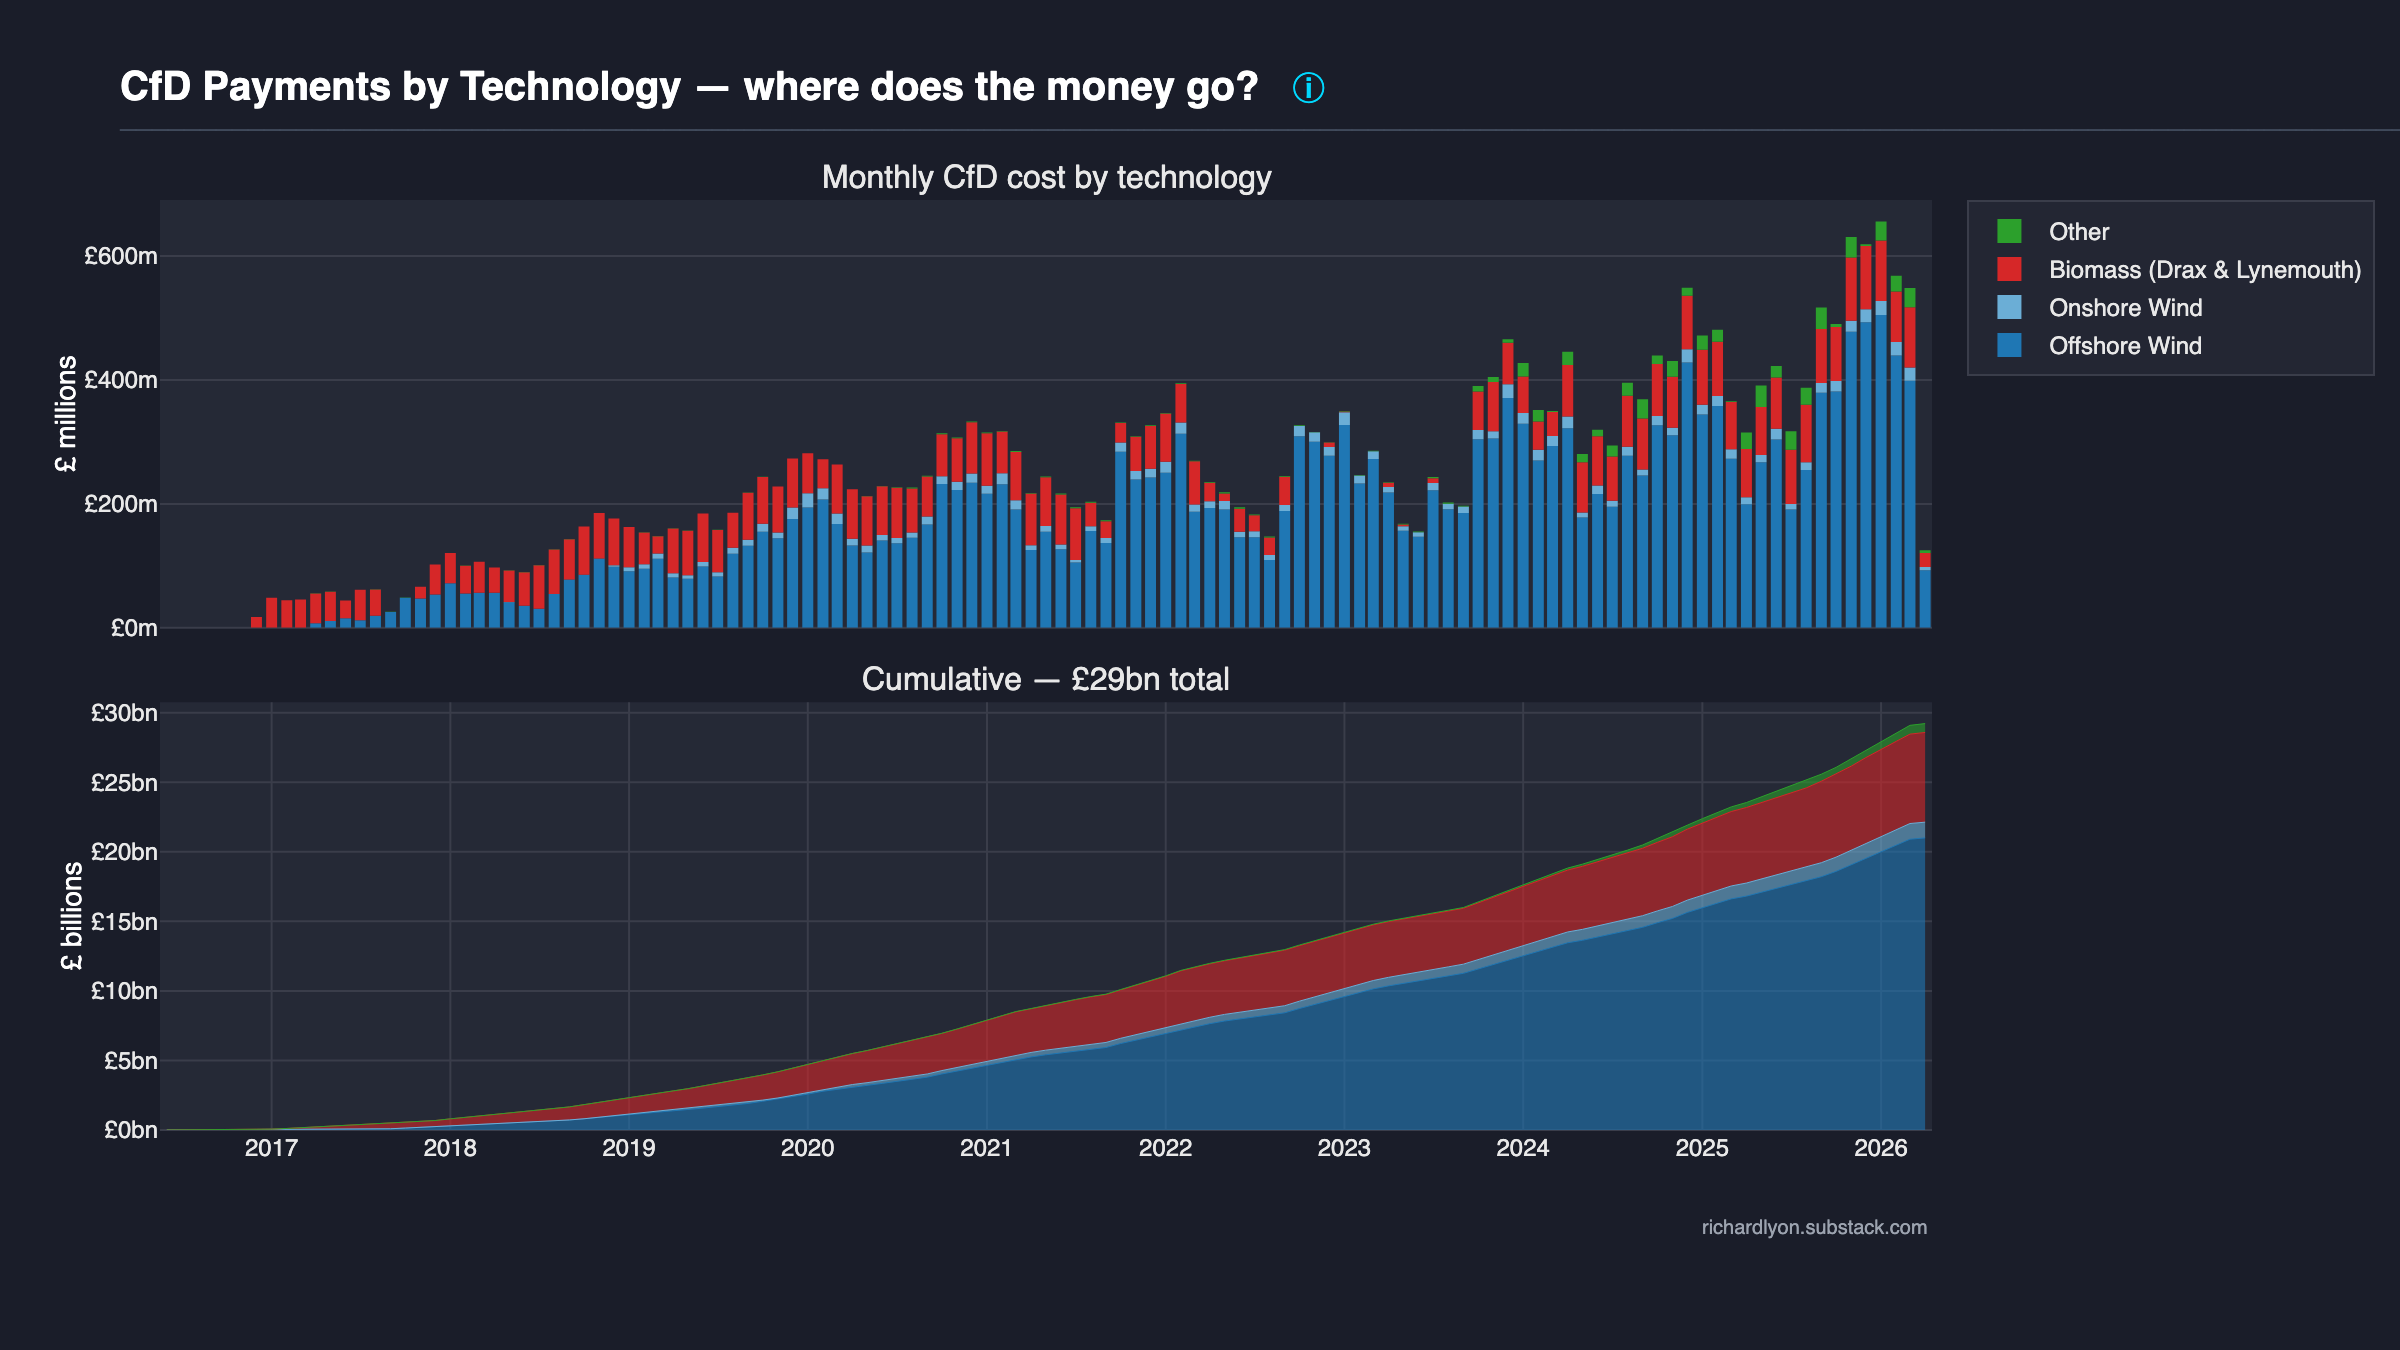
Payments by technology category
Offshore wind and Drax dominate the spend. Full page lives in the Recipients theme — linked here because technology breakdown is also a cost story.
-
RO dynamics — the 2002-2037 RO bill
The legacy scheme twice the CfD's size. £67 bn cumulative, ~£6 bn/yr forward to 2037. Detailed page at Schemes → RO.
-
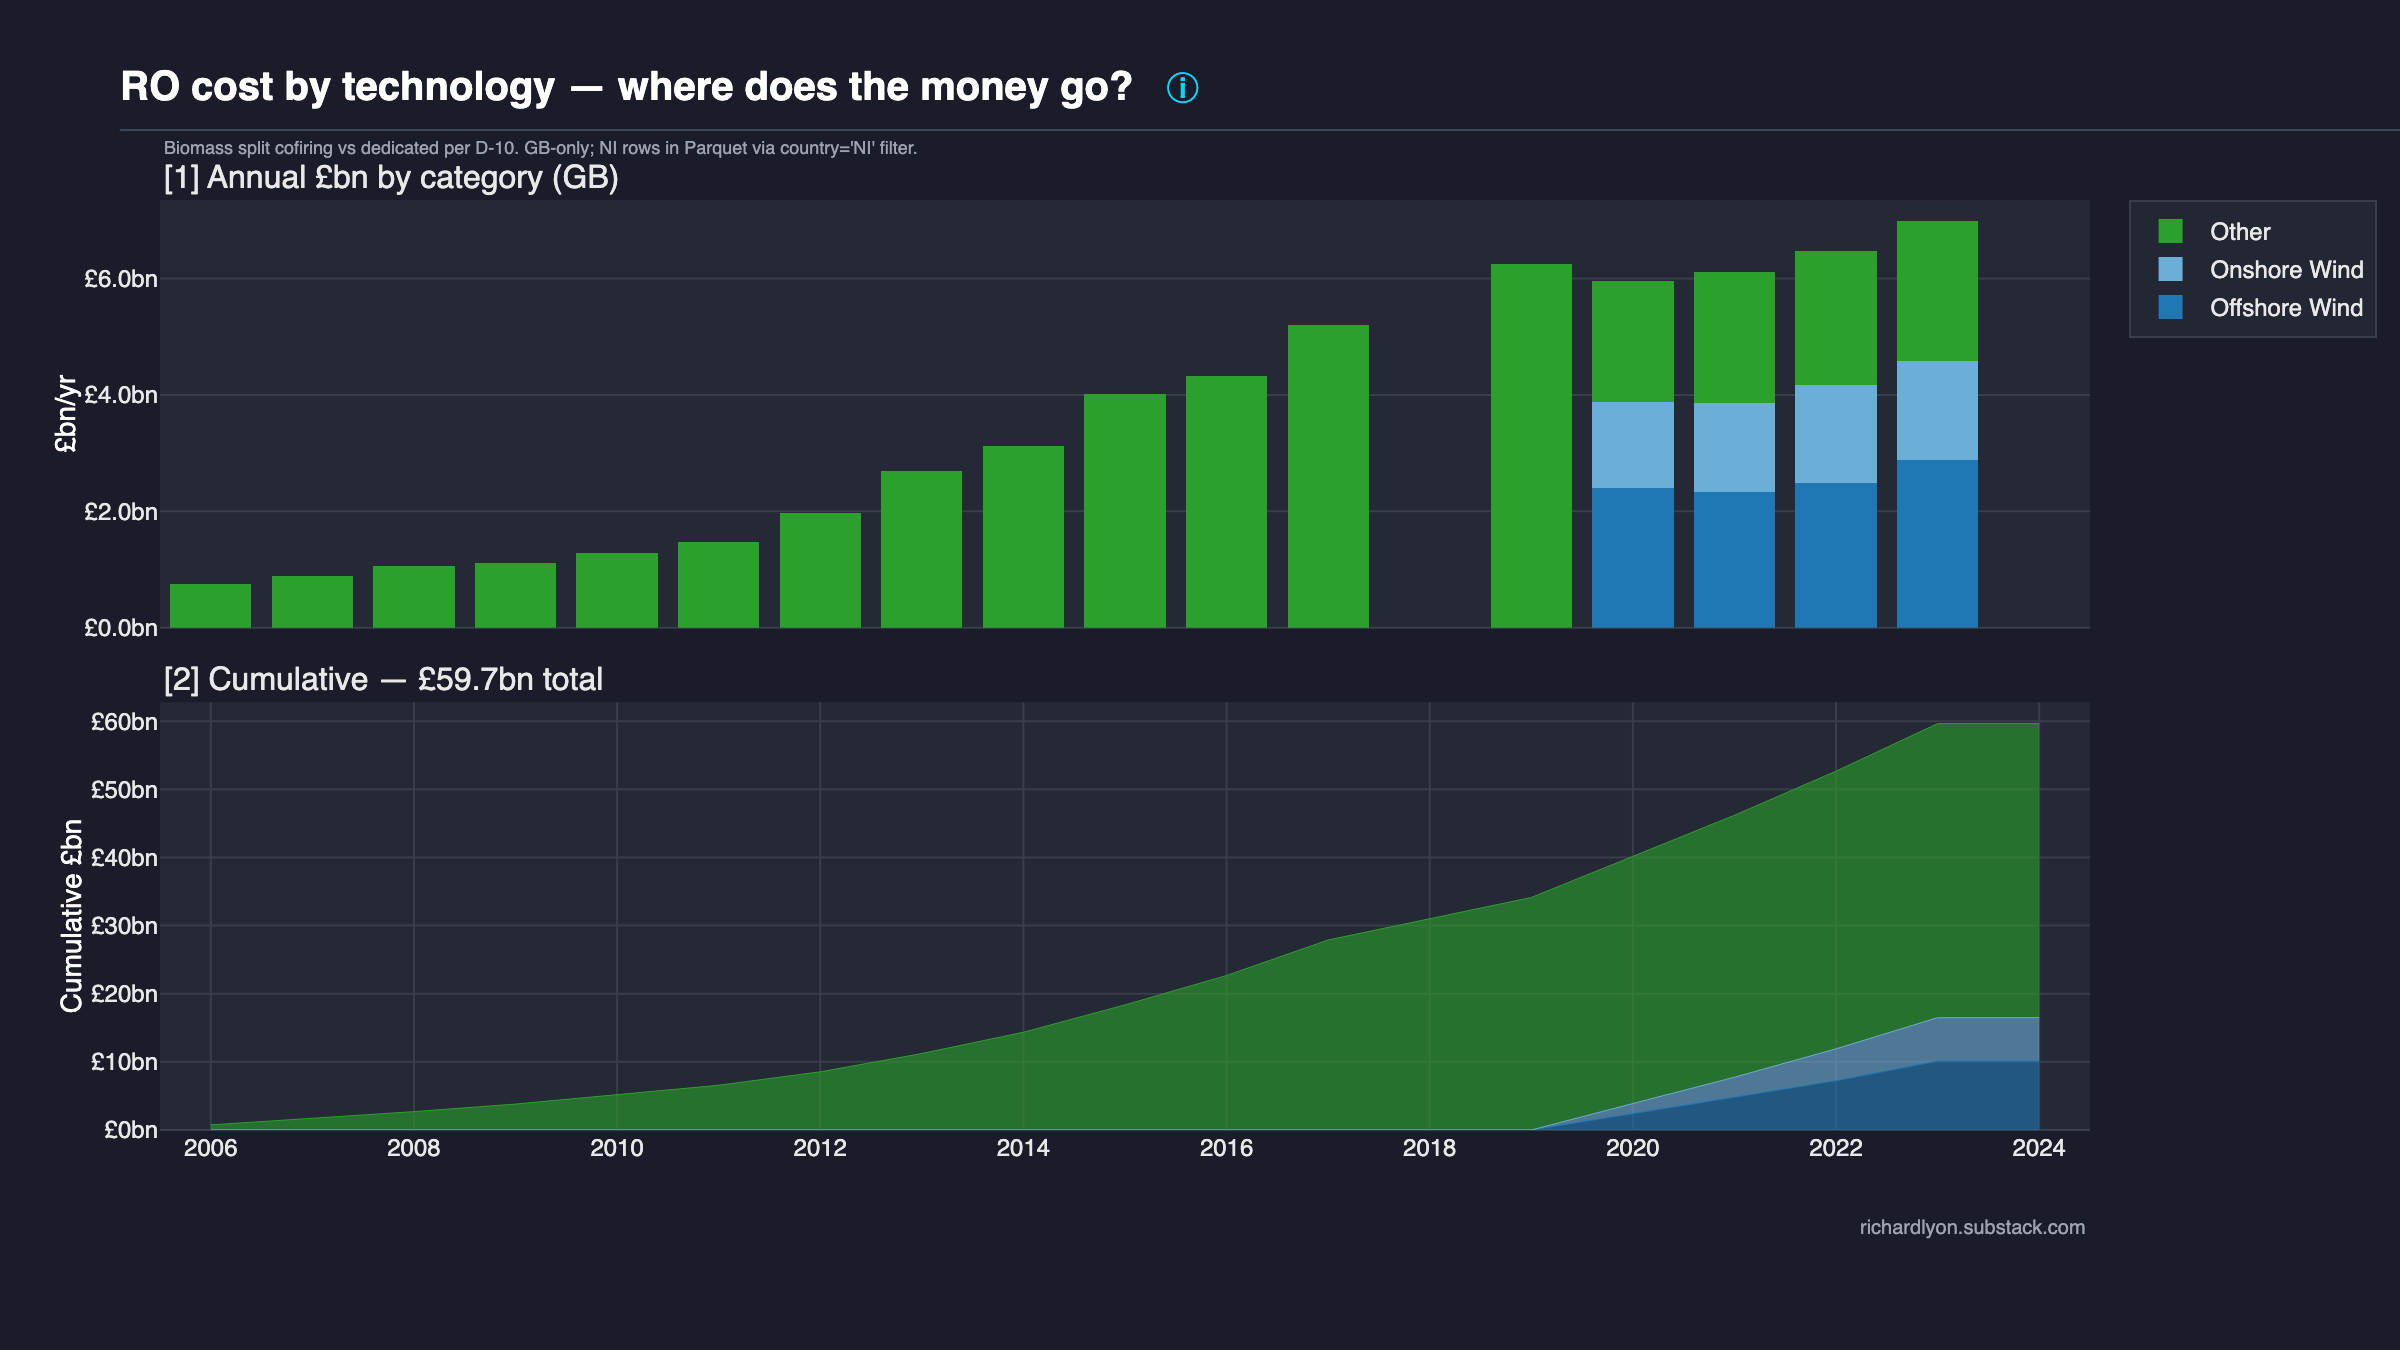
RO by technology — onshore wind, offshore wind, biomass
Cofiring-vs-dedicated biomass split, GB-only. The technology mix that drove the £67 bn legacy bill.
What to look at next
Then → Recipients for who actually gets the money, or → Efficiency for whether this cost is worth what it buys in avoided emissions.
Methodology
How every number on this page was computed → Cost methodology.