21-day rolling minimum — droughts longer than any battery
Wind and solar 21-day rolling-mean capacity factor with drought troughs flagged. Three weeks of structurally low output is the norm, not a tail event — and no deployed battery can economically cover a 21-day span.
What the chart shows
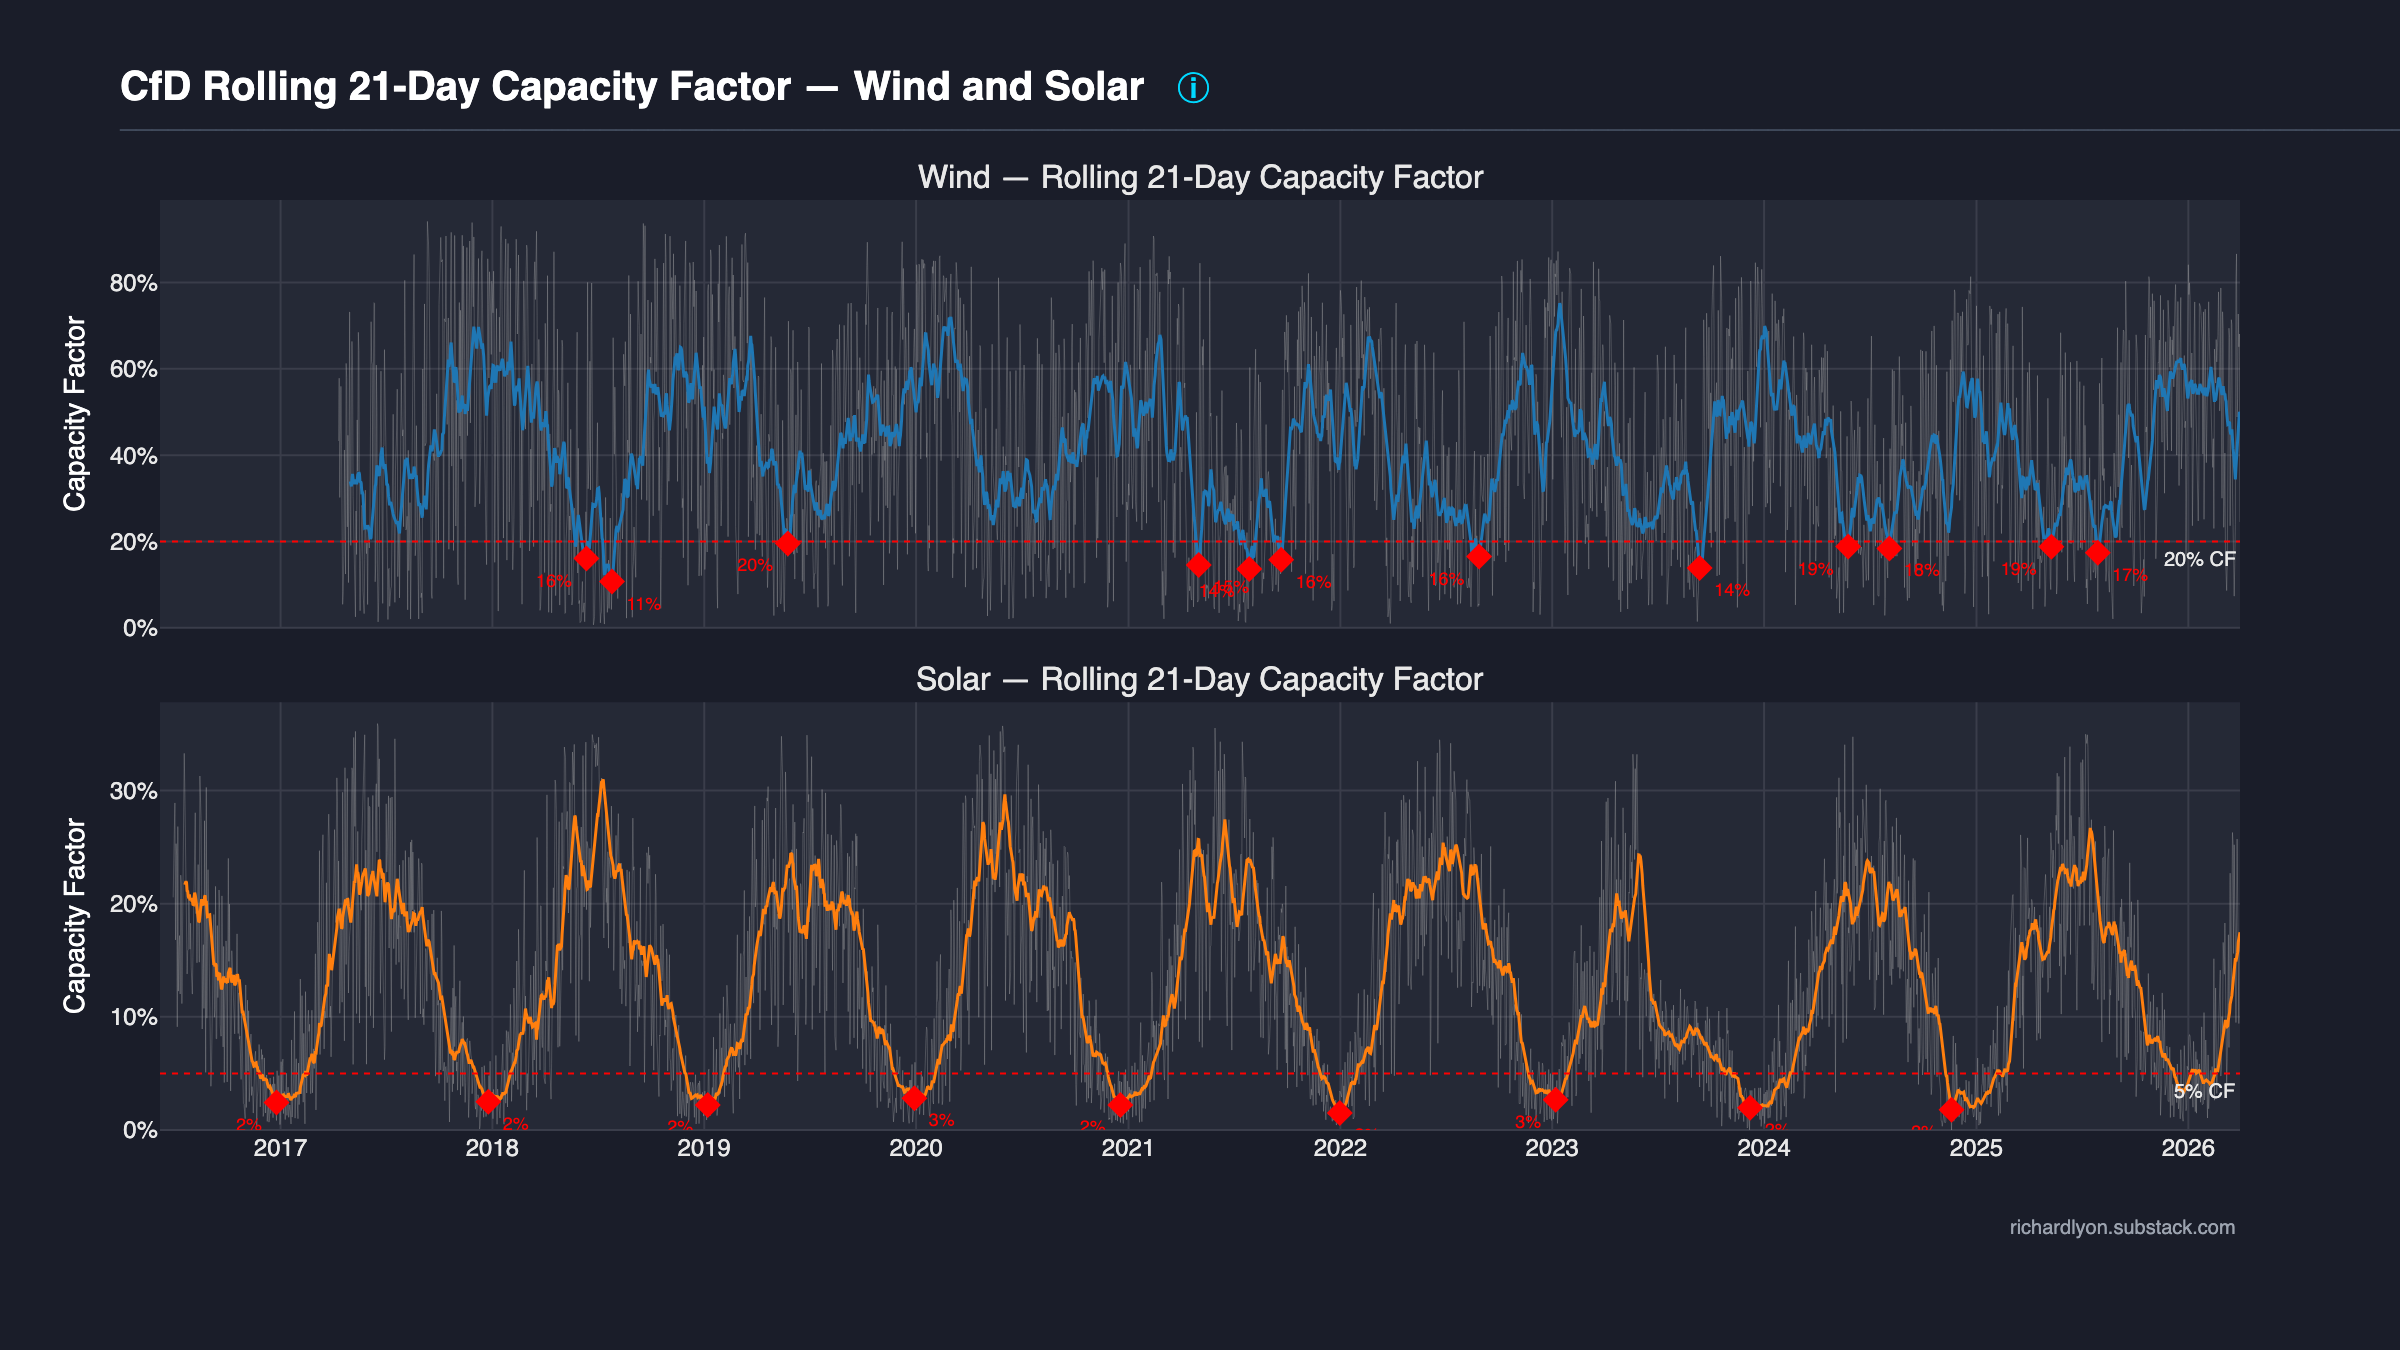
Two panels sharing an x-axis (calendar date, scheme start to latest complete month).
- Top panel — Wind (Offshore + Onshore, combined fleet).
- Bottom panel — Solar PV.
Each panel carries three layers:
- Faint grey line — the raw daily fleet capacity factor (noisy, for context).
- Coloured line — the 21-day centred rolling mean of the daily CF: wind in deep blue, solar in orange. This is the headline series.
- Red diamond markers — significant drought troughs detected
by
scipy.signal.find_peakson the negated rolling-mean series, filtered to those falling below each technology's reference CF line.
Two horizontal reference lines anchor the panels at technology-specific floors: 20% CF for wind and 5% CF for solar. Red diamonds sit only on the local minima that break through those floors; each diamond's hover text identifies the 21-day window's start date, end date, and the worst value achieved.
The argument
The CfD fleet has had multiple 21-day droughts below reference CF. Three weeks is longer than any deployed battery can economically cover. Renewables do not remove the need for firm dispatchable capacity.
Three paragraphs:
-
Why 21 days. The window is a policy-convention choice that roughly maps to the boundary between "covered by batteries + short-term demand response" and "requires dispatchable generation or imports". Sub-week droughts can be bridged by grid-scale lithium-ion at current (2025) capex; multi-week droughts cannot, because the economics of storing enough energy to cover three weeks of fleet shortfall scale the capex wall beyond any plausible deployment in this decade. The chart flags events on the battery-problematic side of that boundary.
-
The troughs are real and recurring. Every red diamond is a historical event — not a scenario, not a simulation. The wind panel carries multiple diamonds spread across years, demonstrating that multi-week droughts below 20% CF are a recurring feature of the fleet's observed operation, not a statistical tail. Solar's diamonds cluster in mid-winter by meteorological necessity; the wind diamonds are scattered across seasons, which is the policy-relevant finding — wind droughts cannot be planned around a seasonal pattern.
-
The policy consequence is structural. If multi-week droughts recur, then the UK grid requires firm dispatchable generation (or imports) to maintain security of supply regardless of how much wind + solar gets built. The cost of retaining that firm capacity is a hidden renewables-attributable cost — it doesn't show up on the CfD levy line, but it does show up in the capacity market (Phase 9 of this portal) and in balancing / constraint costs (Phase 10). Ignoring those costs in the renewables-vs-gas conversation is a category error.
Methodology
Source: LCCC Actual CfD Generation + LCCC CfD Contract Portfolio Status (same daily-CF computation as the generation heatmap).
Daily fleet CF per technology group:
CF_group(d) = sum(CFD_Generation_MWh on day d)
            / (sum(Maximum_Contract_Capacity_MW for active units) × 24)
21-day rolling mean: pd.Series.rolling(window=21, center=True).mean().
Centred (looks 10 days back + 10 days forward) so each trough's date
is the middle of the 21-day window it summarises; windowing removes
high-frequency noise while preserving multi-week structure.
Trough detection:
prominence=0.15 = 15 percentage-point prominence requirement (the
scipy notion of prominence, not altitude): to be counted, a trough
must be separated from neighbouring troughs by a recovery of at least
15 percentage points of CF. This is analogous to topographic
prominence filtering used in mountain classification (e.g. Munros
qualify on prominence, not just elevation). The threshold suppresses
noise-level dips while preserving the economically meaningful droughts.
Reference floors: wind 20%, solar 5%. A detected trough is only rendered as a red diamond if its worst value falls below the technology's floor. See the Reliability methodology for full prominence-tuning rationale.
Caveats
- 21-day window is a policy-convention choice, not a battery-physics
derivation. A 14-day or 30-day window would flag different events.
The chart uses 21 days because it corresponds roughly to the
economic boundary above which current battery capex cannot scale;
a reader with a different boundary in mind can re-run the chart
with a different
WINDOWconstant (see chart source). - Prominence threshold = 15pp is tuned to the current fleet size. As the fleet grows, the absolute MWh at each trough rises — i.e. the economic stakes per trough increase — without changing the chart's per-unit CF values. The chart's appearance is therefore stable under fleet growth but the policy implication strengthens.
- Centred rolling mean truncates the latest 10 days. The right edge of each panel shows raw daily CF but no 21-day rolling-mean value for the final ~10 days of data — peak detection cannot fire there yet. Recent data is more recent than the rolling-mean line suggests.
- Technology grouping decisions matter. Wind pools offshore + onshore. A pure-offshore cut would show fewer extreme troughs (offshore has a slightly more consistent resource); a pure-onshore cut would show more. The combined view reflects what the CfD fleet actually runs.
Data & code
- Generation data — LCCC Actual CfD Generation and avoided GHG emissions
- Portfolio data — LCCC CfD Contract Portfolio Status
- Chart source —
src/uk_subsidy_tracker/plotting/intermittency/rolling_minimum.py - Tests —
tests/test_schemas.py(validates both LCCC schemas this chart joins).
To reproduce:
See also
- Generation heatmap — the same droughts visible as blue stripes in a year × day grid.
- Seasonal capacity factor — the monthly aggregation of the daily CF input.
- CfD forward commitment — the forward commitment these reliability caveats apply to.
- Reliability methodology — full prominence-tuning rationale.