Seasonal capacity factor — observed vs DESNZ assumption
Calendar-month fleet capacity factor by technology, benchmarked against DESNZ's published planning assumptions for new CfD rounds. The observed fleet sits meaningfully below DESNZ's headline numbers in almost every month.
What the chart shows
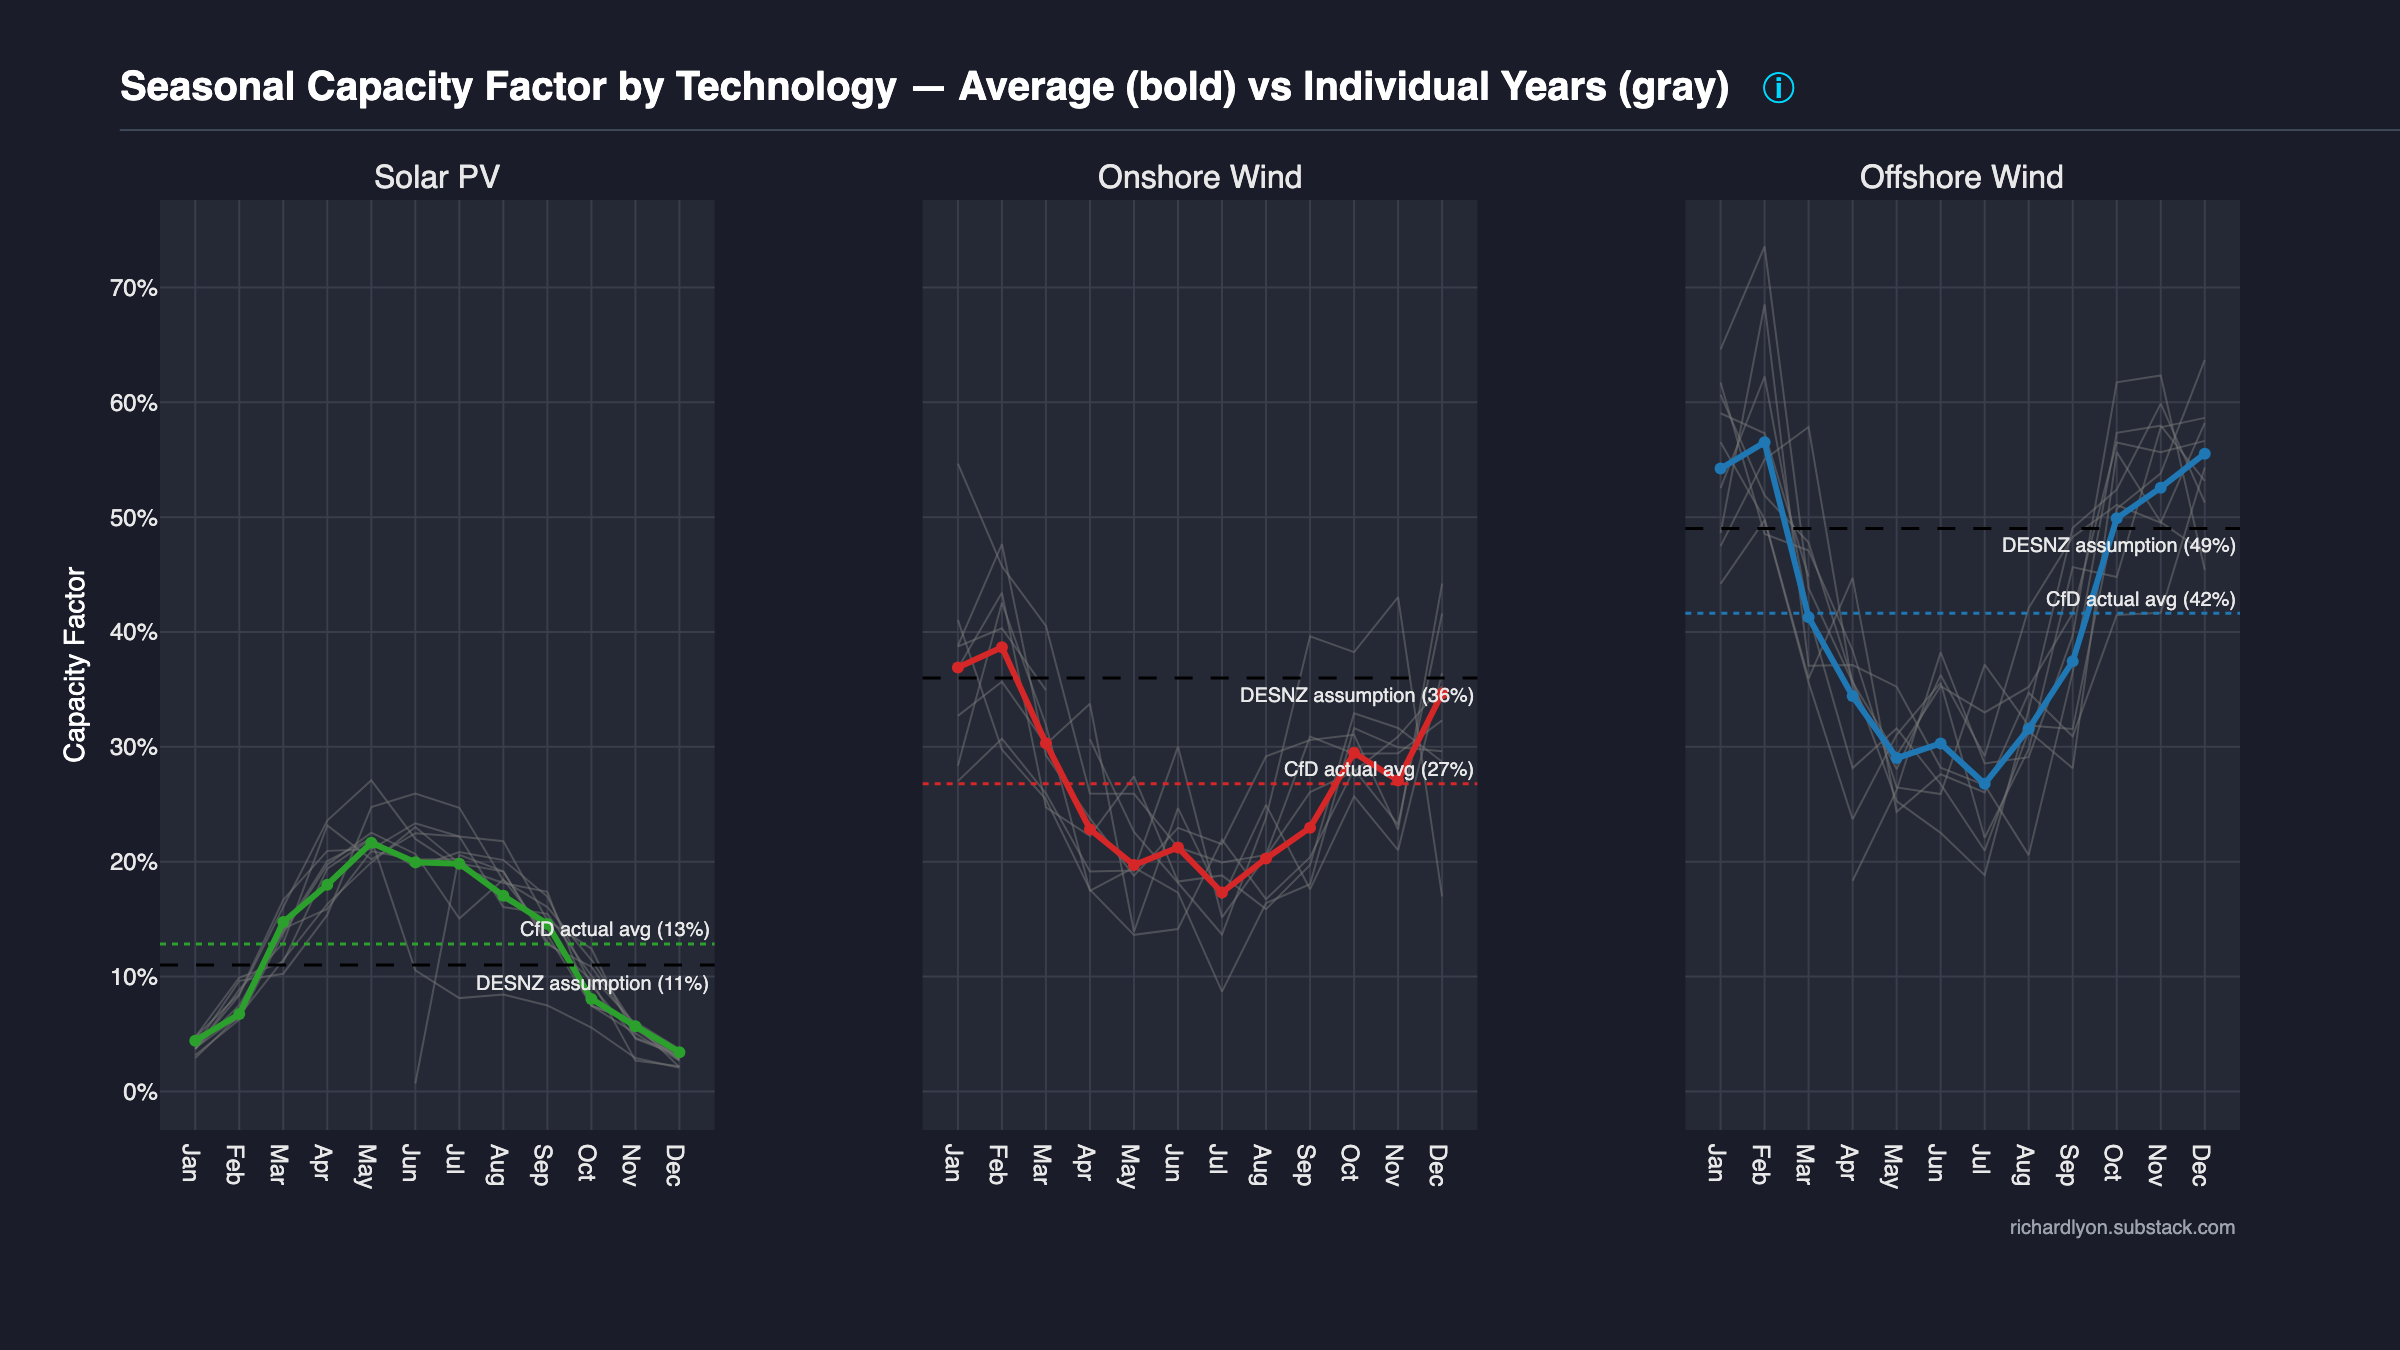
Three side-by-side panels: Offshore Wind, Onshore Wind, and Solar PV. Each panel's x-axis is the calendar month (Jan–Dec); the y-axis is the capacity factor (CF) as a percentage. Two layers per panel:
- Bold coloured line — the fleet-wide average CF for that technology in each calendar month, capacity-weighted across all active CfD units and aggregated across every year of observation.
- Faint grey lines — individual years back to 2017, each showing its own seasonal profile. They give the visual variance envelope around the bold average line.
Two horizontal reference lines are overlaid on every panel:
- CfD actual average — dotted, colour-coded per technology — the annual mean of the bold line; reads as "what the fleet actually averaged across the year".
- DESNZ planning assumption — dashed, black — the value DESNZ uses for planning AR7 (and subsequent rounds') strike-price modelling and budget projections: 49% for Offshore Wind, 36% for Onshore Wind, 11% for Solar PV.
The argument
DESNZ's planning assumptions for new CfD projects (2027–2031) are optimistic — observed fleet capacity factors sit meaningfully below in every technology, in every month.
Three paragraphs:
-
DESNZ's planning CFs drive the CfD economics. Strike-price modelling, allocation-round budget caps, and strategic decarbonisation projections all assume those planning values. The 49% offshore figure, specifically, is the denominator under which the strike-price offered in AR7 gets calibrated: higher assumed CF means a lower strike price clears the auction — or, put the other way, the same strike price implies a higher total revenue expectation to the developer. Get the assumption wrong and either consumers overpay per MWh or developers underbid and under-deliver.
-
The observed CfD fleet runs meaningfully below. For every technology, the bold CF line sits below the dashed DESNZ reference line across most months. Offshore wind peaks into the 50%s in the windy winter months but the annual average (the dotted colour line) lands well under 45% — several percentage points below DESNZ's 49% headline. Onshore wind averages closer to 28–30% vs 36%. Solar sits below 11% on the annual average in multiple years.
-
Either DESNZ's assumptions are wrong, or future units will outperform the existing fleet by 8–10 percentage points. Both are possibilities; neither is costless. If DESNZ is modelling an optimistic CF for a scheme whose economics depend on that CF, every £/MWh strike-price reported in AR7 analysis is structurally understated. If the argument is instead that new AR7 units will run markedly better than every existing unit — bigger turbines, better sites, better availability — then that improvement demands evidence, not assumption. The chart forces that evidence requirement into view.
Methodology
Source: LCCC Actual CfD Generation and avoided GHG emissions (daily
generation) joined with LCCC CfD Contract Portfolio Status (per-unit
Maximum_Contract_Capacity_MW + commissioning date).
Daily capacity factor per unit:
Fleet CF (per technology) = capacity-weighted average across all active units on that day. Pre-commissioning days (before a unit's first recorded generation date) are excluded from both numerator and denominator.
Seasonal aggregation: daily CF values are aggregated to (technology × calendar_month) by averaging across all years, giving the bold coloured line. Each faint grey per-year trace is the same aggregation restricted to a single year.
DESNZ reference values on the dashed line are the published planning assumptions used for AR7+ strike-price modelling (Offshore 49%, Onshore 36%, Solar 11%). They are the anchor benchmark the chart deliberately tests.
See the Reliability methodology for the full installed-capacity-over-time attribution rule.
Caveats
- Capacity factor depends on
installed_capacity_MWfrom the LCCC portfolio snapshot. Mid-construction units have a gradual commissioning ramp-up that the chart does not model: a unit counted from its first generation date is treated as having its full nameplate capacity from day one. This understates CF slightly for units still in the ramp-up window — the real-fleet underperformance vs DESNZ is probably marginally greater than the chart suggests. - Fleet composition changes over time. Early years are dominated by Investment-Contract vintage; recent years include AR1–AR3 builds. The bold fleet-average line therefore blends vintages. DESNZ's comparison is against a new-build AR7 projection, so the comparison is valid only to the extent future units repeat existing fleet behaviour — see argument paragraph 3.
- DESNZ planning assumptions reflect new-build projections, not existing fleet. This is the adversarial payload: the chart tests the published assumption against the closest available proxy — the actual fleet — and finds the proxy runs below.
- Seasonal averages mask year-to-year variance. A year with a poor winter (2021) pulls December's monthly average down; a strong wind year lifts it. The faint grey lines are there to display this variance; they are not decorative.
- No dedicated pytest pin on the CF formula today.
tests/test_schemas.pyvalidates the underlying LCCC portfolio schema, but a CF-formula pin test is a Phase-4 seed (see OQ4 resolution in Reliability methodology — "A note on pin tests"). Any change to the CF formula must be flagged in PR review until the pin lands.
Data & code
- CfD generation data — LCCC Actual CfD Generation and avoided GHG emissions
- Portfolio data — LCCC CfD Contract Portfolio Status
- DESNZ planning assumptions — Energy and Emissions Projections (GOV.UK) (see also the AR7 notice-of-intent round-specific parameters).
- Chart source —
src/uk_subsidy_tracker/plotting/capacity_factor/seasonal.py - Tests —
tests/test_schemas.py(validates LCCC Contract Portfolio Status schema —Technology_Type,Maximum_Contract_Capacity_MWattribution fields),tests/test_aggregates.py(row-conservation pin on the capacity-weighted aggregation pattern)
To reproduce:
See also
- Generation heatmap — same daily CF data, rendered as year × day grid.
- Rolling minimum — multi-week CF droughts.
- Capture ratio — why concentrated-hour output matters for wholesale prices.
- Reliability methodology — CF formula, OQ4 pin-test seed.